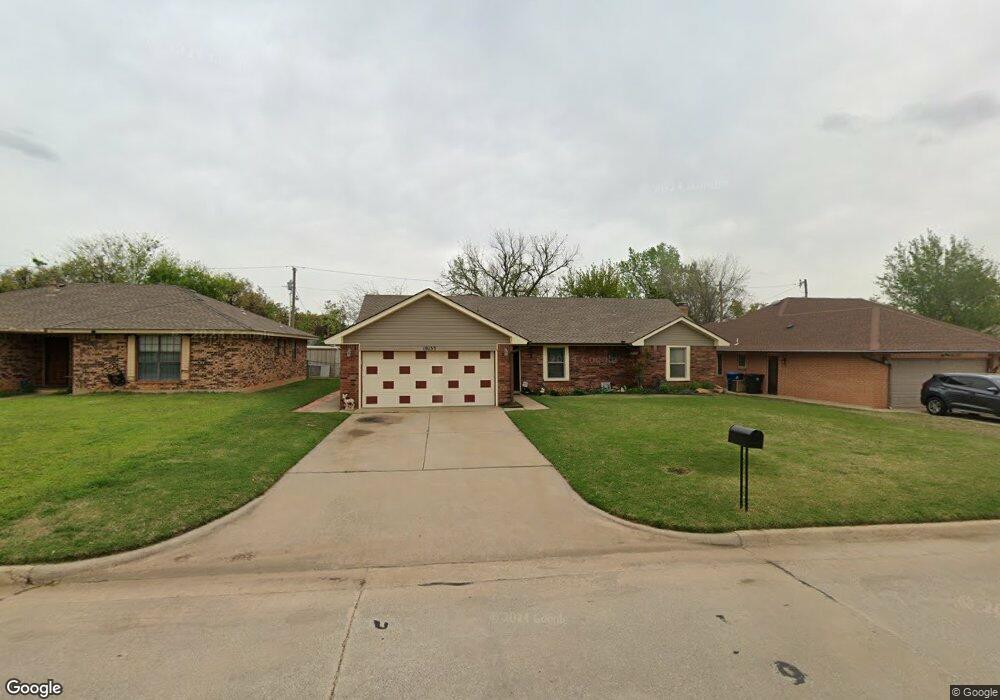
10133 SE 23rd St Oklahoma City, OK 73130
Estimated Value: $205,644 - $245,000
3
Beds
2
Baths
1,687
Sq Ft
$133/Sq Ft
Est. Value
About This Home
This home is located at 10133 SE 23rd St, Oklahoma City, OK 73130 and is currently estimated at $223,661, approximately $132 per square foot. 10133 SE 23rd St is a home located in Oklahoma County with nearby schools including Carl Albert Middle School, Carl Albert High School, and Insight School of Oklahoma High School.
Ownership History
Date
Name
Owned For
Owner Type
Purchase Details
Closed on
Jan 22, 2008
Sold by
Hsbc Bank Usa Na
Bought by
Donahoo William C and Donahoo Paula E
Current Estimated Value
Home Financials for this Owner
Home Financials are based on the most recent Mortgage that was taken out on this home.
Original Mortgage
$63,000
Outstanding Balance
$39,746
Interest Rate
6.15%
Mortgage Type
Unknown
Estimated Equity
$183,915
Purchase Details
Closed on
Oct 30, 2007
Sold by
Ford Reba D
Bought by
Wells Fargo Bank Na
Purchase Details
Closed on
Mar 22, 2005
Sold by
Foster Lance E
Bought by
Williams Dennis L and Williams Sebrina A
Purchase Details
Closed on
Mar 16, 2005
Sold by
Williams Dennis L and Williams Sebrina A
Bought by
Ford Reba D and Ford Marvin E
Purchase Details
Closed on
Feb 11, 2004
Sold by
Williams Dennis and Williams Sebrina
Bought by
Foster Lance E
Create a Home Valuation Report for This Property
The Home Valuation Report is an in-depth analysis detailing your home's value as well as a comparison with similar homes in the area
Home Values in the Area
Average Home Value in this Area
Purchase History
| Date | Buyer | Sale Price | Title Company |
|---|---|---|---|
| Donahoo William C | $105,000 | Oklahoma Reo Closing & Title | |
| Hsbc Bank Usa Na | -- | Oklahoma Reo Closing & Title | |
| Wells Fargo Bank Na | -- | None Available | |
| Williams Dennis L | -- | -- | |
| Ford Reba D | $115,000 | Oklahoma City Abstract & Tit | |
| Foster Lance E | $102,000 | -- |
Source: Public Records
Mortgage History
| Date | Status | Borrower | Loan Amount |
|---|---|---|---|
| Open | Donahoo William C | $63,000 |
Source: Public Records
Tax History Compared to Growth
Tax History
| Year | Tax Paid | Tax Assessment Tax Assessment Total Assessment is a certain percentage of the fair market value that is determined by local assessors to be the total taxable value of land and additions on the property. | Land | Improvement |
|---|---|---|---|---|
| 2024 | $1,785 | $16,650 | $3,125 | $13,525 |
| 2023 | $1,785 | $16,166 | $2,257 | $13,909 |
| 2022 | $1,714 | $15,695 | $2,521 | $13,174 |
| 2021 | $1,701 | $15,238 | $2,793 | $12,445 |
| 2020 | $1,693 | $14,795 | $2,994 | $11,801 |
| 2019 | $1,606 | $14,672 | $2,969 | $11,703 |
| 2018 | $1,350 | $14,245 | $0 | $0 |
| 2017 | $1,442 | $13,878 | $2,928 | $10,950 |
| 2016 | $1,435 | $13,474 | $2,994 | $10,480 |
| 2015 | $1,503 | $13,548 | $2,681 | $10,867 |
| 2014 | $1,470 | $13,285 | $2,681 | $10,604 |
Source: Public Records
Map
Nearby Homes
- 2320 Celina Dr
- 2328 Celina Dr
- 2332 Celina Dr
- 9832 Crest Dr
- 1717 Crest Cir
- 10323 Haven Cir
- 1917 Goldenrod Ln
- 10520 SE 23rd St
- 13985 SE 29th St
- 9609 Rhythm Rd
- 10553 SE 23rd St
- 2402 Cattail Cir
- 2332 Snapper Ln
- 1501 S Avery Ave
- 1725 Ballad Dr
- 2708 Snapper Ln
- 1704 Symphony Ln
- 10733 Painted Turtle Way
- Carlisle Plan at Turtlewood
- Bella Plan at Turtlewood
- 10129 SE 23rd St
- 10137 SE 23rd St
- 10125 SE 23rd St
- 10141 SE 23rd St
- 2313 Celina Dr
- 10128 SE 23rd St
- 10132 SE 23rd St
- 10121 SE 23rd St
- 2309 Celina Dr
- 2300 Alicia Dr
- 10136 SE 23rd St
- 10140 SE 23rd St
- 2304 Alicia Dr
- 10125 Alicia Dr
- 10117 SE 23rd St
- 10129 Alicia Dr
- 2301 Celina Dr
- 2200 S Post Rd
- 2325 Celina Dr
- 2312 Celina Dr