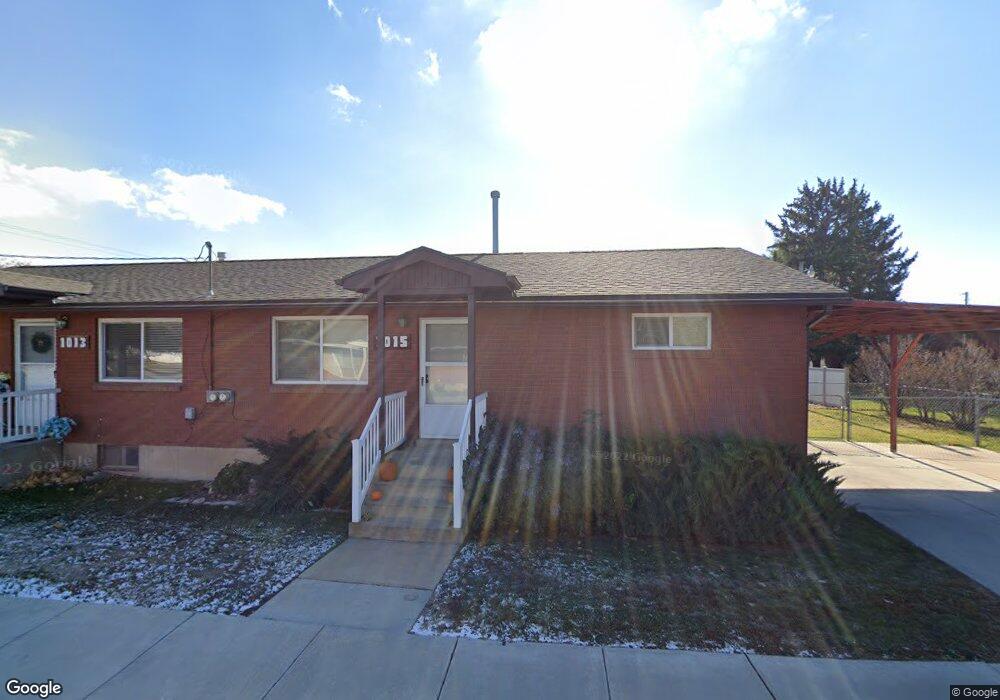
1015 Grants Ln Syracuse, UT 84075
Estimated Value: $531,168 - $532,000
4
Beds
2
Baths
1,792
Sq Ft
$297/Sq Ft
Est. Value
About This Home
This home is located at 1015 Grants Ln, Syracuse, UT 84075 and is currently estimated at $531,584, approximately $296 per square foot. 1015 Grants Ln is a home with nearby schools including Bluff Ridge Elementary, Legacy Junior High School, and Clearfield High School.
Ownership History
Date
Name
Owned For
Owner Type
Purchase Details
Closed on
Jun 5, 2019
Sold by
Richard & Robyn Investments Llc
Bought by
R G Thurgood Investments Llc
Current Estimated Value
Purchase Details
Closed on
Nov 19, 2010
Sold by
Association Of Unit Owners Of Grants Lan
Bought by
Thurgood John F and Thurgood Charolette H
Purchase Details
Closed on
Aug 24, 1998
Sold by
Thurgood Richard G and Thurgood Robyn
Bought by
Banks Rodney and Banks Nicole
Create a Home Valuation Report for This Property
The Home Valuation Report is an in-depth analysis detailing your home's value as well as a comparison with similar homes in the area
Home Values in the Area
Average Home Value in this Area
Purchase History
| Date | Buyer | Sale Price | Title Company |
|---|---|---|---|
| R G Thurgood Investments Llc | -- | None Available | |
| Thurgood John F | -- | None Available | |
| Banks Rodney | -- | Bonneville Title Company Inc |
Source: Public Records
Tax History Compared to Growth
Tax History
| Year | Tax Paid | Tax Assessment Tax Assessment Total Assessment is a certain percentage of the fair market value that is determined by local assessors to be the total taxable value of land and additions on the property. | Land | Improvement |
|---|---|---|---|---|
| 2025 | $2,867 | $276,650 | $119,915 | $156,735 |
| 2024 | $2,780 | $270,049 | $94,582 | $175,467 |
| 2023 | $2,593 | $252,450 | $72,625 | $179,824 |
| 2022 | $2,777 | $490,000 | $139,330 | $350,670 |
| 2021 | $2,297 | $345,000 | $112,730 | $232,270 |
| 2020 | $2,070 | $301,000 | $100,492 | $200,508 |
| 2019 | $2,013 | $289,000 | $95,433 | $193,567 |
| 2018 | $1,804 | $257,000 | $93,659 | $163,341 |
| 2016 | $1,543 | $115,280 | $36,051 | $79,229 |
| 2015 | $1,492 | $106,150 | $31,534 | $74,616 |
| 2014 | $1,389 | $100,767 | $31,534 | $69,233 |
| 2013 | -- | $111,998 | $29,327 | $82,671 |
Source: Public Records
Map
Nearby Homes