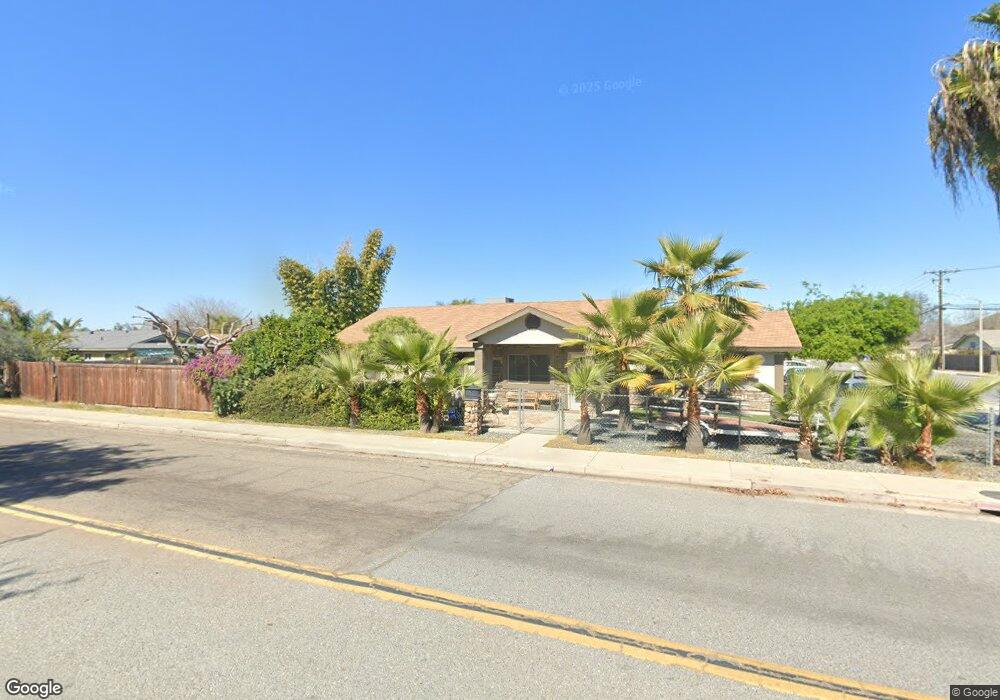
1015 N Prospect St Porterville, CA 93257
Porterville Northwest NeighborhoodEstimated Value: $281,627 - $331,000
3
Beds
2
Baths
1,200
Sq Ft
$260/Sq Ft
Est. Value
About This Home
This home is located at 1015 N Prospect St, Porterville, CA 93257 and is currently estimated at $311,407, approximately $259 per square foot. 1015 N Prospect St is a home located in Tulare County with nearby schools including Westfield Elementary School, Sequoia Middle School, and Monache High School.
Ownership History
Date
Name
Owned For
Owner Type
Purchase Details
Closed on
Jul 30, 2013
Sold by
Martinez Jose Luis Tapia
Bought by
Torres Maly
Current Estimated Value
Home Financials for this Owner
Home Financials are based on the most recent Mortgage that was taken out on this home.
Original Mortgage
$111,925
Outstanding Balance
$81,063
Interest Rate
3.75%
Mortgage Type
FHA
Estimated Equity
$230,344
Purchase Details
Closed on
Jan 10, 2013
Sold by
Ruiz Maria
Bought by
Federal National Mortgage Association
Purchase Details
Closed on
May 9, 2006
Sold by
Ruiz Maria Fe
Bought by
Ruiz Maria P and Ruiz Teresa
Purchase Details
Closed on
Jan 11, 1995
Sold by
Ramirez Jorge
Bought by
Ruiz Maria P and Ruiz Teresa
Home Financials for this Owner
Home Financials are based on the most recent Mortgage that was taken out on this home.
Original Mortgage
$70,850
Interest Rate
9.2%
Create a Home Valuation Report for This Property
The Home Valuation Report is an in-depth analysis detailing your home's value as well as a comparison with similar homes in the area
Home Values in the Area
Average Home Value in this Area
Purchase History
| Date | Buyer | Sale Price | Title Company |
|---|---|---|---|
| Torres Maly | -- | Lawyers Title Company | |
| Torres Maly | $117,500 | Lawyers Title Company | |
| Federal National Mortgage Association | $101,100 | Landsafe Title | |
| Ruiz Maria P | -- | None Available | |
| Ruiz Maria P | $79,000 | Fidelity National Title |
Source: Public Records
Mortgage History
| Date | Status | Borrower | Loan Amount |
|---|---|---|---|
| Open | Torres Maly | $111,925 | |
| Previous Owner | Ruiz Maria P | $70,850 |
Source: Public Records
Tax History Compared to Growth
Tax History
| Year | Tax Paid | Tax Assessment Tax Assessment Total Assessment is a certain percentage of the fair market value that is determined by local assessors to be the total taxable value of land and additions on the property. | Land | Improvement |
|---|---|---|---|---|
| 2025 | $1,530 | $144,036 | $42,902 | $101,134 |
| 2024 | $1,530 | $141,212 | $42,061 | $99,151 |
| 2023 | $1,528 | $138,444 | $41,237 | $97,207 |
| 2022 | $1,481 | $135,730 | $40,429 | $95,301 |
| 2021 | $1,464 | $133,068 | $39,636 | $93,432 |
| 2020 | $1,448 | $131,704 | $39,230 | $92,474 |
| 2019 | $1,422 | $129,122 | $38,461 | $90,661 |
| 2018 | $1,397 | $126,590 | $37,707 | $88,883 |
| 2017 | $1,362 | $124,108 | $36,968 | $87,140 |
| 2016 | $1,308 | $121,674 | $36,243 | $85,431 |
| 2015 | $1,289 | $119,847 | $35,699 | $84,148 |
| 2014 | $1,258 | $117,500 | $35,000 | $82,500 |
Source: Public Records
Map
Nearby Homes
- 1045 N Westside St
- 1076 N Beverly St
- 700 N Prospect St
- 1245 Atkins St
- 640 N Prospect St
- 1121 N Lindale Way
- 1089 Pioneer Ave
- 1041 Greenfield Dr
- 1370 Lindale Place
- 1644 Mccomb Ave
- 1691 Terry Ct
- 1421 Pamela Cir
- 1060 W Belleview Ave
- 1681 W Wall Ln
- 681 W Mulberry Ave
- 1087 W Belleview Ave
- 816 W Grand Ave
- 701 W Theta Ave
- 474 Douglas St
- 701 Theta Ave
- 1025 N Prospect St
- 1016 Westside St
- 1035 N Prospect St
- 1026 Westside St
- 1514 N Prospect St
- 1036 N Westside St
- 1036 Westside St
- 1045 N Prospect St
- 1190 W Mulberry Ave
- 1190 W Mulberry Ave
- 1026 N Prospect St
- 1046 Westside St
- 1046 N Westside St
- 1191 Sandra Ave
- 1015 N Westside St
- 1055 N Prospect St
- 1015 Westside St
- 1056 Westside St
- 1025 Westside St
- 1056 N Westside St