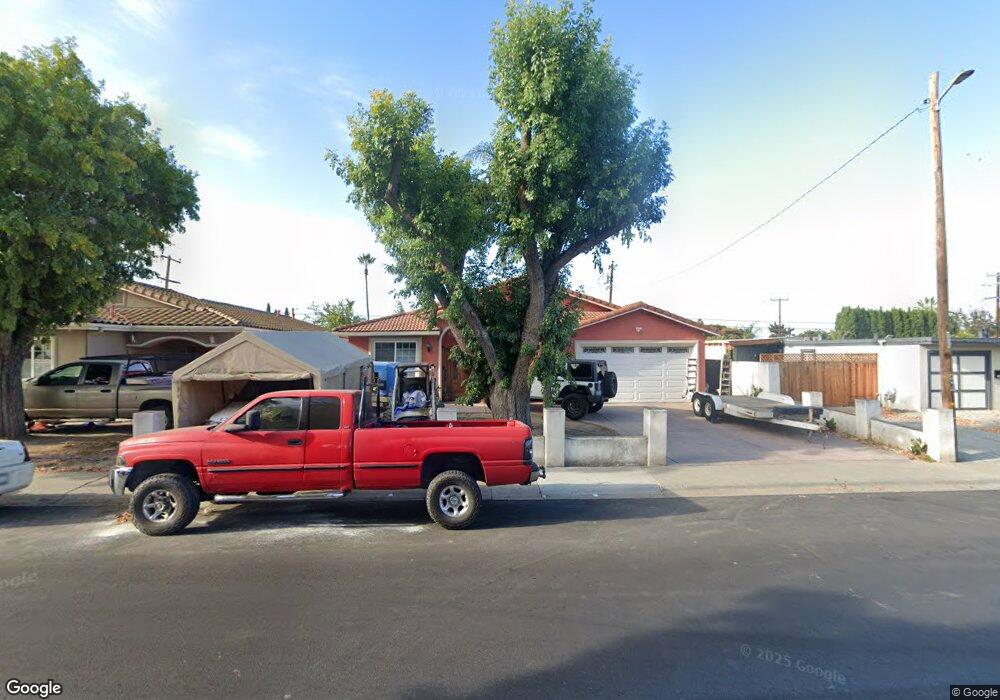
10151 Griffith St San Jose, CA 95127
Mount Pleasant NeighborhoodEstimated Value: $1,068,000 - $1,188,830
4
Beds
3
Baths
1,942
Sq Ft
$572/Sq Ft
Est. Value
About This Home
This home is located at 10151 Griffith St, San Jose, CA 95127 and is currently estimated at $1,110,958, approximately $572 per square foot. 10151 Griffith St is a home located in Santa Clara County with nearby schools including Mt. Pleasant High School, Voices College-Bound Language Academy at Mt. Pleasant, and Rocketship Academy Brilliant Minds.
Ownership History
Date
Name
Owned For
Owner Type
Purchase Details
Closed on
Mar 3, 2006
Sold by
Retana Carlos
Bought by
Hernandez Leticia
Current Estimated Value
Home Financials for this Owner
Home Financials are based on the most recent Mortgage that was taken out on this home.
Original Mortgage
$435,000
Outstanding Balance
$244,535
Interest Rate
6.08%
Mortgage Type
New Conventional
Estimated Equity
$866,423
Purchase Details
Closed on
Apr 30, 2002
Sold by
Green Maynard and Green Rudell A
Bought by
Retana Carlos and Hernandez Leticia
Home Financials for this Owner
Home Financials are based on the most recent Mortgage that was taken out on this home.
Original Mortgage
$288,000
Interest Rate
7.13%
Purchase Details
Closed on
Nov 16, 2001
Sold by
Green Rudell A and Green Rudell
Bought by
Green Maynard and Green Rudell A
Home Financials for this Owner
Home Financials are based on the most recent Mortgage that was taken out on this home.
Original Mortgage
$130,000
Interest Rate
6.75%
Create a Home Valuation Report for This Property
The Home Valuation Report is an in-depth analysis detailing your home's value as well as a comparison with similar homes in the area
Home Values in the Area
Average Home Value in this Area
Purchase History
| Date | Buyer | Sale Price | Title Company |
|---|---|---|---|
| Hernandez Leticia | -- | Commonwealth Land Title Co | |
| Retana Carlos | $320,000 | Old Republic Title Company | |
| Green Maynard | -- | Old Republic Title Company |
Source: Public Records
Mortgage History
| Date | Status | Borrower | Loan Amount |
|---|---|---|---|
| Open | Hernandez Leticia | $435,000 | |
| Closed | Retana Carlos | $288,000 | |
| Previous Owner | Green Maynard | $130,000 |
Source: Public Records
Tax History Compared to Growth
Tax History
| Year | Tax Paid | Tax Assessment Tax Assessment Total Assessment is a certain percentage of the fair market value that is determined by local assessors to be the total taxable value of land and additions on the property. | Land | Improvement |
|---|---|---|---|---|
| 2025 | $9,502 | $640,047 | $189,082 | $450,965 |
| 2024 | $9,502 | $627,498 | $185,375 | $442,123 |
| 2023 | $9,161 | $615,195 | $181,741 | $433,454 |
| 2022 | $9,094 | $603,133 | $178,178 | $424,955 |
| 2021 | $9,134 | $591,308 | $174,685 | $416,623 |
| 2020 | $8,768 | $585,246 | $172,894 | $412,352 |
| 2019 | $8,553 | $573,771 | $169,504 | $404,267 |
| 2018 | $8,321 | $562,522 | $166,181 | $396,341 |
| 2017 | $8,210 | $551,493 | $162,923 | $388,570 |
| 2016 | $7,954 | $540,680 | $159,729 | $380,951 |
| 2015 | $7,956 | $532,559 | $157,330 | $375,229 |
| 2014 | $7,440 | $522,128 | $154,249 | $367,879 |
Source: Public Records
Map
Nearby Homes
- 10230 Griffith St
- 10170 Regan St
- 10311 Ryan St
- 10281 Murtha Dr
- 1122 Lancelot Ln
- 3253 Arthur Ave
- 3341 Hickerson Dr
- 1310 Park Pleasant Cir
- 14440 Victoria Ct
- 10150 Clayton Rd
- 1651 Estates Ct
- 3382 Mount Wilson Dr
- 13754 Highwood Dr
- 567 Nordyke Dr
- 3472 Kaylene Dr
- 3514 Ramstad Dr
- 3434 Dominick Ct
- 3457 Ramstad Dr
- 14545 Jerilyn Dr
- 3405 E Hills Dr
- 10141 Griffith St
- 10161 Griffith St
- 10150 Torrance Ave
- 10140 Torrance Ave
- 10160 Torrance Ave
- 10131 Griffith St
- 10171 Griffith St
- 10130 Torrance Ave
- 10170 Torrance Ave
- 10160 Griffith St
- 14151 Vernice Ave
- 10181 Griffith St
- 10121 Griffith St
- 10170 Griffith St
- 10120 Torrance Ave
- 10180 Torrance Ave
- 10180 Griffith St
- 14161 Vernice Ave
- 10191 Griffith St
- 10111 Griffith St