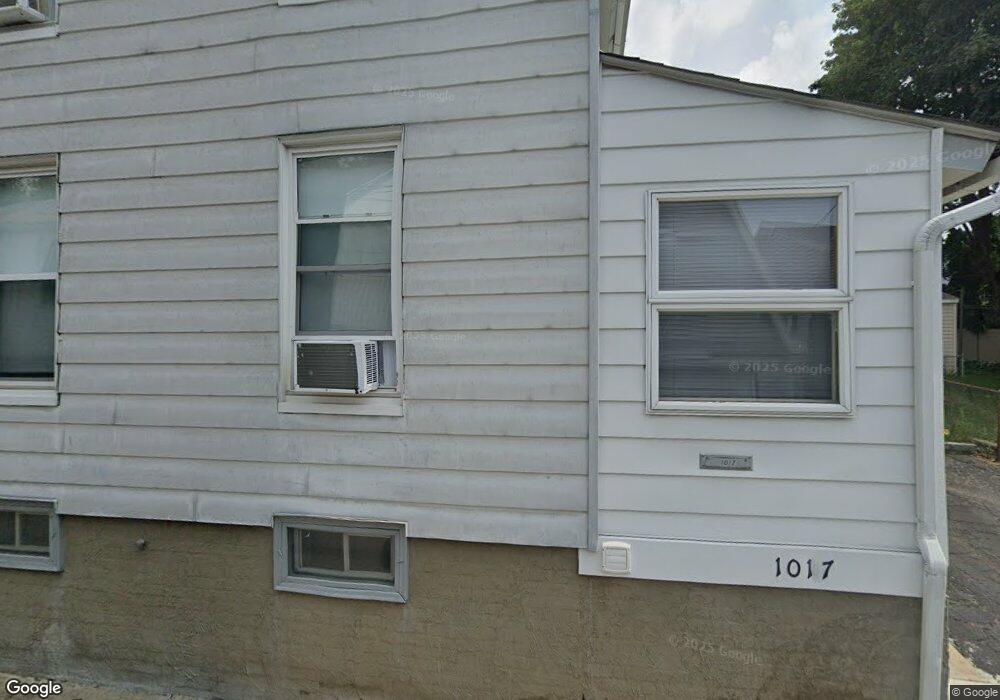
1017 Blackberry St Catasauqua, PA 18032
Estimated Value: $136,000 - $284,000
2
Beds
1
Bath
1,486
Sq Ft
$143/Sq Ft
Est. Value
About This Home
This home is located at 1017 Blackberry St, Catasauqua, PA 18032 and is currently estimated at $212,238, approximately $142 per square foot. 1017 Blackberry St is a home located in Northampton County with nearby schools including Francis H Sheckler Elementary School, Catasauqua Middle School, and Catasauqua Senior High School.
Ownership History
Date
Name
Owned For
Owner Type
Purchase Details
Closed on
Nov 26, 2019
Sold by
Chabak Agnes
Bought by
Kibler Randy Freeland and Kibler Jennifer M
Current Estimated Value
Home Financials for this Owner
Home Financials are based on the most recent Mortgage that was taken out on this home.
Original Mortgage
$53,600
Outstanding Balance
$47,256
Interest Rate
3.6%
Mortgage Type
New Conventional
Estimated Equity
$164,982
Create a Home Valuation Report for This Property
The Home Valuation Report is an in-depth analysis detailing your home's value as well as a comparison with similar homes in the area
Home Values in the Area
Average Home Value in this Area
Purchase History
| Date | Buyer | Sale Price | Title Company |
|---|---|---|---|
| Kibler Randy Freeland | $67,000 | Penn Abstract & Land Svcs Ll |
Source: Public Records
Mortgage History
| Date | Status | Borrower | Loan Amount |
|---|---|---|---|
| Open | Kibler Randy Freeland | $53,600 |
Source: Public Records
Tax History Compared to Growth
Tax History
| Year | Tax Paid | Tax Assessment Tax Assessment Total Assessment is a certain percentage of the fair market value that is determined by local assessors to be the total taxable value of land and additions on the property. | Land | Improvement |
|---|---|---|---|---|
| 2025 | $326 | $30,200 | $9,700 | $20,500 |
| 2024 | $2,519 | $30,200 | $9,700 | $20,500 |
| 2023 | $2,409 | $30,200 | $9,700 | $20,500 |
| 2022 | $2,436 | $30,200 | $9,700 | $20,500 |
| 2021 | $2,516 | $30,200 | $9,700 | $20,500 |
| 2020 | $2,570 | $30,200 | $9,700 | $20,500 |
| 2019 | $2,505 | $30,200 | $9,700 | $20,500 |
| 2018 | $2,430 | $30,200 | $9,700 | $20,500 |
| 2017 | $2,336 | $30,200 | $9,700 | $20,500 |
| 2016 | -- | $30,200 | $9,700 | $20,500 |
| 2015 | -- | $30,200 | $9,700 | $20,500 |
| 2014 | -- | $30,200 | $9,700 | $20,500 |
Source: Public Records
Map
Nearby Homes