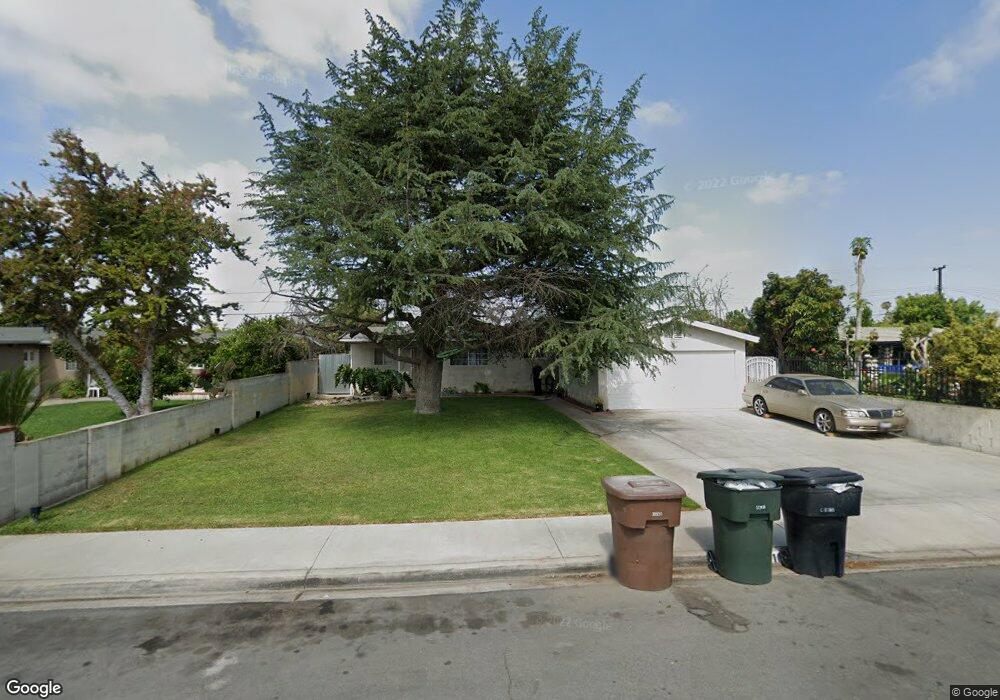
10171 Antigua St Anaheim, CA 92804
West Anaheim NeighborhoodEstimated Value: $911,000 - $1,009,000
4
Beds
2
Baths
1,150
Sq Ft
$830/Sq Ft
Est. Value
About This Home
This home is located at 10171 Antigua St, Anaheim, CA 92804 and is currently estimated at $954,261, approximately $829 per square foot. 10171 Antigua St is a home located in Orange County with nearby schools including Walt Disney Elementary School, Dale Jr High School, and Magnolia High.
Ownership History
Date
Name
Owned For
Owner Type
Purchase Details
Closed on
Aug 17, 2022
Sold by
Marquez Miranda Peter
Bought by
Huerta Jeffry and Huerta Jannett
Current Estimated Value
Home Financials for this Owner
Home Financials are based on the most recent Mortgage that was taken out on this home.
Original Mortgage
$788,500
Outstanding Balance
$750,620
Interest Rate
4.99%
Mortgage Type
New Conventional
Estimated Equity
$203,641
Purchase Details
Closed on
Jul 12, 2019
Sold by
Nguyen Tony
Bought by
Marquez Miranda Peter and Marquez Emelia
Home Financials for this Owner
Home Financials are based on the most recent Mortgage that was taken out on this home.
Original Mortgage
$455,000
Interest Rate
7.15%
Mortgage Type
Adjustable Rate Mortgage/ARM
Purchase Details
Closed on
Mar 28, 2019
Sold by
Celia Delfin Separate Property Trust
Bought by
Nguyen Tony
Purchase Details
Closed on
Oct 27, 2008
Sold by
Delfin Celia
Bought by
Delfin Celia and The Celia Delfin Separate Property Trust
Create a Home Valuation Report for This Property
The Home Valuation Report is an in-depth analysis detailing your home's value as well as a comparison with similar homes in the area
Home Values in the Area
Average Home Value in this Area
Purchase History
| Date | Buyer | Sale Price | Title Company |
|---|---|---|---|
| Huerta Jeffry | $830,000 | New Title Company Name | |
| Marquez Miranda Peter | $570,000 | First American Title Company | |
| Nguyen Tony | $480,000 | First American Title Co | |
| Delfin Celia | -- | None Available |
Source: Public Records
Mortgage History
| Date | Status | Borrower | Loan Amount |
|---|---|---|---|
| Open | Huerta Jeffry | $788,500 | |
| Previous Owner | Marquez Miranda Peter | $455,000 |
Source: Public Records
Tax History Compared to Growth
Tax History
| Year | Tax Paid | Tax Assessment Tax Assessment Total Assessment is a certain percentage of the fair market value that is determined by local assessors to be the total taxable value of land and additions on the property. | Land | Improvement |
|---|---|---|---|---|
| 2025 | $9,705 | $863,532 | $806,640 | $56,892 |
| 2024 | $9,705 | $846,600 | $790,823 | $55,777 |
| 2023 | $9,462 | $830,000 | $775,316 | $54,684 |
| 2022 | $6,839 | $587,423 | $533,204 | $54,219 |
| 2021 | $6,814 | $575,905 | $522,749 | $53,156 |
| 2020 | $6,728 | $570,000 | $517,389 | $52,611 |
| 2019 | $1,034 | $57,166 | $26,799 | $30,367 |
| 2018 | $1,002 | $56,046 | $26,274 | $29,772 |
| 2017 | $985 | $54,948 | $25,759 | $29,189 |
| 2016 | $972 | $53,871 | $25,254 | $28,617 |
| 2015 | $949 | $53,062 | $24,874 | $28,188 |
| 2014 | $921 | $52,023 | $24,387 | $27,636 |
Source: Public Records
Map
Nearby Homes
- 10301 Antigua St
- 10301 Rhiems Rd
- 1250 S Brookhurst St Unit 1059
- 1250 S Brookhurst St Unit 2028
- 1250 S Brookhurst St Unit 2080
- 1250 S Brookhurst St
- 1250 S Brookhurst St Unit 2033
- 994 S Sutter Creek Rd Unit 60
- 998 S Crossbow Ln Unit 12D
- 938 S Sutter Creek Rd Unit 54
- 958 S Crossbow Ln Unit 8
- 917 S Sutter Creek Rd Unit 46
- 1350 S Ashington Ln
- 1944 W Lullaby Ln
- 927 S Webster Ave
- 2131 W Niobe Ave
- 9272 Cerritos Ave
- 930 S Emerald St
- 2217 W Orange Ave
- 2217 W Orange Ave Unit 18
- 10161 Antigua St
- 10181 Antigua St
- 10172 Perdido St
- 10201 Antigua St
- 10151 Antigua St
- 10162 Perdido St
- 10182 Perdido St
- 10152 Perdido St
- 10202 Perdido St
- 10172 Antigua St
- 10141 Antigua St
- 10211 Antigua St
- 10182 Antigua St
- 10162 Antigua St
- 10202 Antigua St
- 10142 Perdido St
- 10152 Antigua St
- 10212 Perdido St
- 10131 Antigua St
- 10142 Antigua St