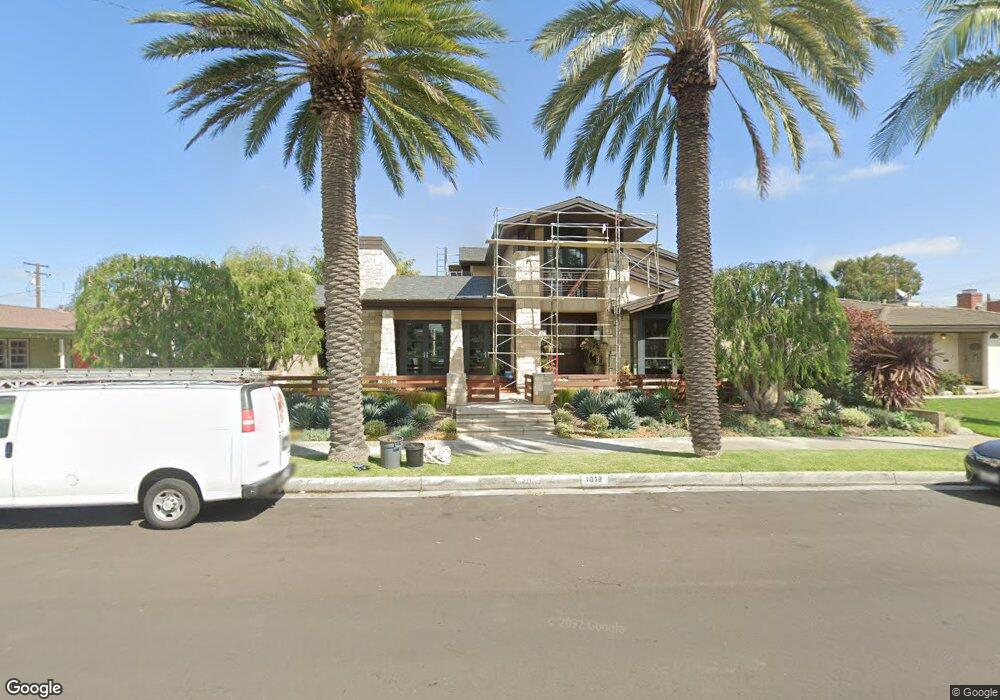
1019 12th St Huntington Beach, CA 92648
Estimated Value: $1,965,000 - $6,258,000
3
Beds
1
Bath
7,856
Sq Ft
$583/Sq Ft
Est. Value
About This Home
This home is located at 1019 12th St, Huntington Beach, CA 92648 and is currently estimated at $4,583,410, approximately $583 per square foot. 1019 12th St is a home located in Orange County with nearby schools including Agnes L. Smith Elementary, Ethel Dwyer Middle, and Huntington Beach High School.
Ownership History
Date
Name
Owned For
Owner Type
Purchase Details
Closed on
Sep 17, 2018
Sold by
Chen Jonson I Nien and Chen Samantha
Bought by
Chen Jonson I Nien and J Chen Family Trust
Current Estimated Value
Purchase Details
Closed on
Mar 26, 2015
Sold by
Chen Jonson I and Chen Samantha
Bought by
Chen Family Trust
Purchase Details
Closed on
Aug 10, 2009
Sold by
Chen Jonson I and Chen Samantha
Bought by
Chen Jonson I and Chen Samantha
Purchase Details
Closed on
Oct 28, 2008
Sold by
Livingston Larry J and Livingston Elaine B
Bought by
Chen Jonson I and Chen Samantha
Create a Home Valuation Report for This Property
The Home Valuation Report is an in-depth analysis detailing your home's value as well as a comparison with similar homes in the area
Home Values in the Area
Average Home Value in this Area
Purchase History
| Date | Buyer | Sale Price | Title Company |
|---|---|---|---|
| Chen Jonson I Nien | -- | None Available | |
| Chen Family Trust | -- | None Available | |
| Chen Jonson I | -- | First American Title Company | |
| Chen Jonson I | $1,385,000 | First American Title |
Source: Public Records
Tax History Compared to Growth
Tax History
| Year | Tax Paid | Tax Assessment Tax Assessment Total Assessment is a certain percentage of the fair market value that is determined by local assessors to be the total taxable value of land and additions on the property. | Land | Improvement |
|---|---|---|---|---|
| 2025 | $41,424 | $3,803,144 | $1,636,788 | $2,166,356 |
| 2024 | $41,424 | $3,728,573 | $1,604,694 | $2,123,879 |
| 2023 | $40,516 | $3,655,464 | $1,573,229 | $2,082,235 |
| 2022 | $39,461 | $3,583,789 | $1,542,382 | $2,041,407 |
| 2021 | $38,721 | $3,513,519 | $1,512,139 | $2,001,380 |
| 2020 | $38,476 | $3,477,493 | $1,496,634 | $1,980,859 |
| 2019 | $38,001 | $3,409,307 | $1,467,288 | $1,942,019 |
| 2018 | $37,410 | $3,342,458 | $1,438,517 | $1,903,941 |
| 2017 | $36,914 | $3,276,920 | $1,410,311 | $1,866,609 |
| 2016 | $35,229 | $3,212,667 | $1,382,658 | $1,830,009 |
| 2015 | $34,979 | $3,164,410 | $1,361,889 | $1,802,521 |
| 2014 | $34,250 | $3,102,424 | $1,335,211 | $1,767,213 |
Source: Public Records
Map
Nearby Homes