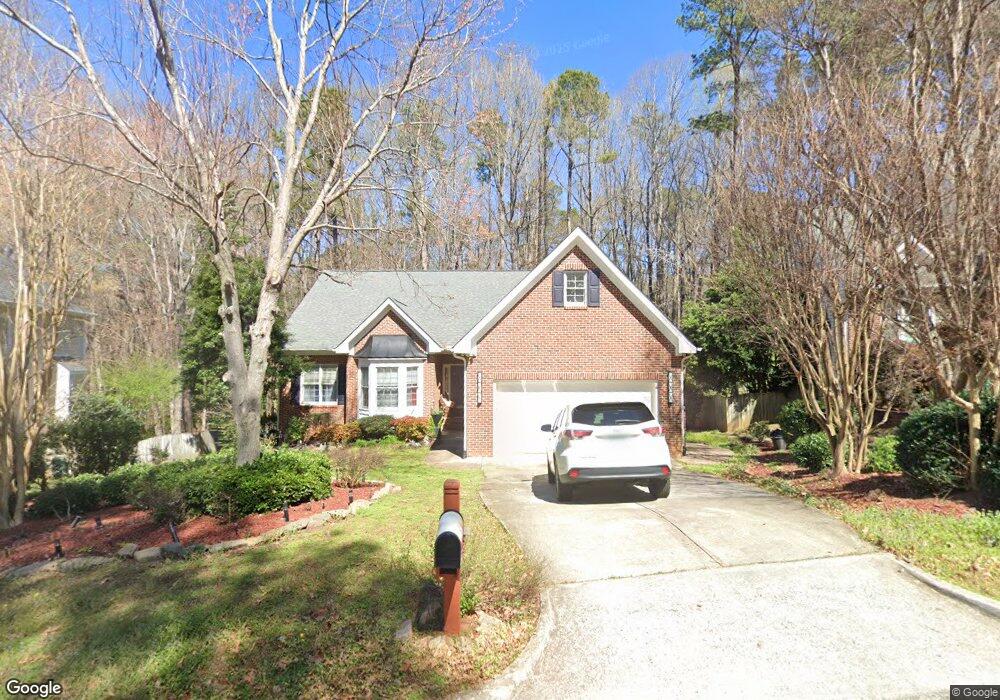
102 Bourne Wood Dr Cary, NC 27518
Lochmere NeighborhoodEstimated Value: $648,620 - $685,000
4
Beds
3
Baths
2,547
Sq Ft
$264/Sq Ft
Est. Value
About This Home
This home is located at 102 Bourne Wood Dr, Cary, NC 27518 and is currently estimated at $672,155, approximately $263 per square foot. 102 Bourne Wood Dr is a home located in Wake County with nearby schools including Swift Creek Elementary School, Dillard Drive Magnet Middle School, and Thales Academy Cary Pre-K-6.
Ownership History
Date
Name
Owned For
Owner Type
Purchase Details
Closed on
Mar 29, 2019
Sold by
Odoom Baaba P
Bought by
Odoom Baaba P and Baaba P Odoom Revocable Living
Current Estimated Value
Purchase Details
Closed on
Oct 26, 2018
Sold by
Odoom Charles Owusu
Bought by
Odoom Baaba P
Home Financials for this Owner
Home Financials are based on the most recent Mortgage that was taken out on this home.
Original Mortgage
$330,000
Outstanding Balance
$289,575
Interest Rate
4.7%
Mortgage Type
New Conventional
Estimated Equity
$382,580
Purchase Details
Closed on
Jan 27, 2000
Sold by
St Lawrence Homes Inc
Bought by
Fitzpatrick John M and Fitzpatrick Katherine F
Home Financials for this Owner
Home Financials are based on the most recent Mortgage that was taken out on this home.
Original Mortgage
$100,000
Interest Rate
7.9%
Create a Home Valuation Report for This Property
The Home Valuation Report is an in-depth analysis detailing your home's value as well as a comparison with similar homes in the area
Home Values in the Area
Average Home Value in this Area
Purchase History
| Date | Buyer | Sale Price | Title Company |
|---|---|---|---|
| Odoom Baaba P | -- | None Available | |
| Odoom Baaba P | -- | None Available | |
| Odoom Baaba P | $390,000 | None Available | |
| Fitzpatrick John M | $295,000 | -- |
Source: Public Records
Mortgage History
| Date | Status | Borrower | Loan Amount |
|---|---|---|---|
| Open | Odoom Baaba P | $330,000 | |
| Previous Owner | Fitzpatrick John M | $100,000 |
Source: Public Records
Tax History Compared to Growth
Tax History
| Year | Tax Paid | Tax Assessment Tax Assessment Total Assessment is a certain percentage of the fair market value that is determined by local assessors to be the total taxable value of land and additions on the property. | Land | Improvement |
|---|---|---|---|---|
| 2025 | $5,337 | $620,393 | $230,000 | $390,393 |
| 2024 | $5,222 | $620,393 | $230,000 | $390,393 |
| 2023 | $4,416 | $438,683 | $94,000 | $344,683 |
| 2022 | $4,251 | $438,683 | $94,000 | $344,683 |
| 2021 | $4,166 | $438,683 | $94,000 | $344,683 |
| 2020 | $4,187 | $438,683 | $94,000 | $344,683 |
| 2019 | $4,175 | $388,062 | $94,000 | $294,062 |
| 2018 | $3,918 | $388,062 | $94,000 | $294,062 |
| 2017 | $3,765 | $388,062 | $94,000 | $294,062 |
| 2016 | $3,709 | $388,062 | $94,000 | $294,062 |
| 2015 | $3,937 | $397,847 | $90,000 | $307,847 |
| 2014 | $3,712 | $397,847 | $90,000 | $307,847 |
Source: Public Records
Map
Nearby Homes
- 105 Crosswaite Way
- 6315 Tryon Rd
- 406 Cricketfield Ln
- 104 Jersey Ridge Rd
- 202 Coltsgate Dr
- 105 Headlands Ln
- 210 Coltsgate Dr
- 307 Durington Place
- 0 SE Cary Pkwy Unit 2491180
- 101 Turnberry Ln
- 304 W Kirkfield Dr
- 107 Tower Hamlet Dr
- 2414 Stephens Rd
- 1728 Callandale Ave
- 102 Ravenstone Dr
- 2434 Stephens Rd
- 131 Longbridge Dr
- 4311 Wellington Ridge Loop
- 647 Newlyn Dr
- 1221 Renshaw Ct
- 104 Bourne Wood Dr
- 100 Bourne Wood Dr
- 102 Marvista Ct
- 101 Bourne Wood Dr
- 103 Bourne Wood Dr
- 2808 Piney Plains Rd
- 104 Marvista Ct
- 101 Marvista Ct
- 100 Jaslie Dr
- 103 Jaslie Dr
- 2804 Piney Plains Rd
- 103 Marvista Ct
- 106 Marvista Ct
- 2817 Piney Plains Rd
- 102 Jaslie Dr
- 2901 Piney Plains Rd
- 105 Marvista Ct
- 102 Vinecrest Ct
- 2800 Piney Plains Rd
- 105 Jaslie Dr