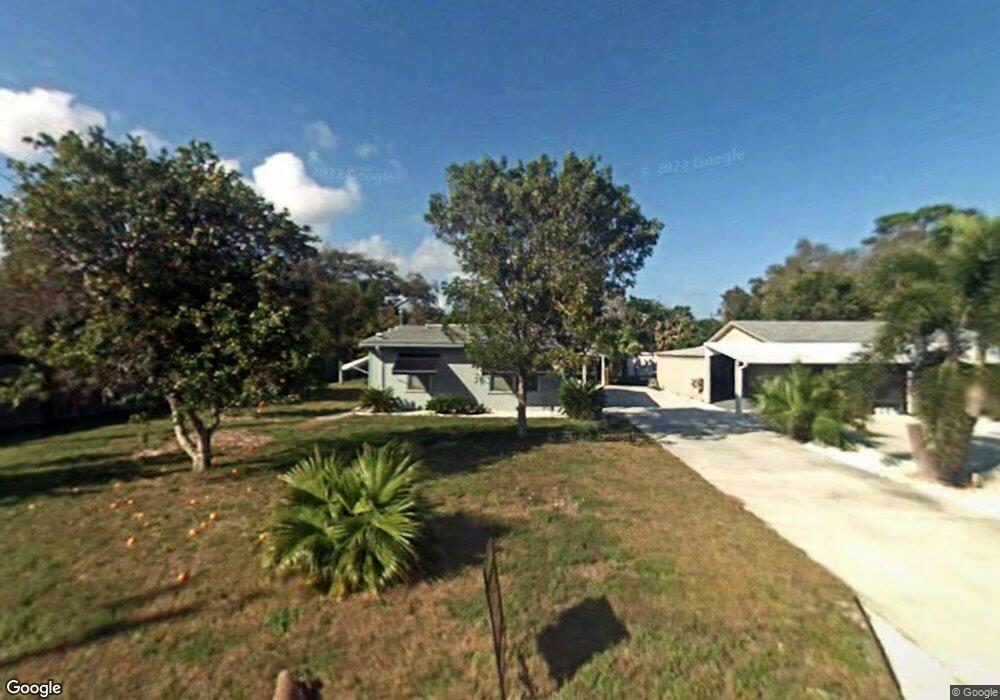
102 Ollie St North Fort Myers, FL 33917
Diplomat NeighborhoodEstimated Value: $82,000 - $181,000
1
Bed
1
Bath
665
Sq Ft
$179/Sq Ft
Est. Value
About This Home
This home is located at 102 Ollie St, North Fort Myers, FL 33917 and is currently estimated at $119,315, approximately $179 per square foot. 102 Ollie St is a home located in Lee County with nearby schools including J. Colin English Elementary School, Dr. Carrie D. Robinson Littleton Elementary School, and Tropic Isles Elementary School.
Ownership History
Date
Name
Owned For
Owner Type
Purchase Details
Closed on
Jul 1, 2021
Sold by
Binowski David R
Bought by
Binowski David R and Binowski Tammie S
Current Estimated Value
Purchase Details
Closed on
May 9, 2013
Sold by
Federal National Mortgage Association
Bought by
Binowski David R
Home Financials for this Owner
Home Financials are based on the most recent Mortgage that was taken out on this home.
Original Mortgage
$31,825
Outstanding Balance
$22,663
Interest Rate
3.59%
Mortgage Type
New Conventional
Estimated Equity
$96,652
Purchase Details
Closed on
Feb 25, 2013
Sold by
Kane William
Bought by
Federal National Mortgage Association
Purchase Details
Closed on
Aug 28, 2005
Sold by
Miller Denzil and Miller Karen Watson
Bought by
Kane William F and Kane Judy M
Home Financials for this Owner
Home Financials are based on the most recent Mortgage that was taken out on this home.
Original Mortgage
$52,200
Interest Rate
5.71%
Mortgage Type
Fannie Mae Freddie Mac
Create a Home Valuation Report for This Property
The Home Valuation Report is an in-depth analysis detailing your home's value as well as a comparison with similar homes in the area
Home Values in the Area
Average Home Value in this Area
Purchase History
| Date | Buyer | Sale Price | Title Company |
|---|---|---|---|
| Binowski David R | -- | Accommodation | |
| Binowski David R | $33,500 | New House Title Llc | |
| Federal National Mortgage Association | -- | None Available | |
| Kane William F | $58,000 | Team Title Insurance Inc |
Source: Public Records
Mortgage History
| Date | Status | Borrower | Loan Amount |
|---|---|---|---|
| Open | Binowski David R | $31,825 | |
| Previous Owner | Kane William F | $52,200 |
Source: Public Records
Tax History Compared to Growth
Tax History
| Year | Tax Paid | Tax Assessment Tax Assessment Total Assessment is a certain percentage of the fair market value that is determined by local assessors to be the total taxable value of land and additions on the property. | Land | Improvement |
|---|---|---|---|---|
| 2025 | $351 | $26,538 | -- | -- |
| 2024 | $321 | $25,790 | -- | -- |
| 2023 | $321 | $25,039 | $0 | $0 |
| 2022 | $410 | $24,310 | $0 | $0 |
| 2021 | $355 | $48,304 | $10,631 | $37,673 |
| 2020 | $346 | $23,276 | $0 | $0 |
| 2019 | $333 | $22,753 | $0 | $0 |
| 2018 | $332 | $22,329 | $0 | $0 |
| 2017 | $322 | $21,870 | $0 | $0 |
| 2016 | $287 | $48,598 | $10,669 | $37,929 |
| 2015 | $278 | $33,700 | $6,482 | $27,218 |
| 2014 | -- | $21,102 | $6,260 | $14,842 |
| 2013 | -- | $20,299 | $7,162 | $13,137 |
Source: Public Records
Map
Nearby Homes
- 1807 Powell Dr
- 4921 Bayshore Rd
- 1685 Daniels Dr
- 1992 Queen St
- 210 Cobblestone Ln
- 216 Captains Walk
- 1404 Keuka Ave
- 209 Captains Walk Unit 6
- 1616 Daniels Dr
- 1338 Old Bridge Rd
- 45 Galleon Dr
- 208 Brandywine Ln
- 210 Brandywine Ln
- 93 E Mariana Ave
- 174 Santa fe Trail
- 48 Galleon Dr
- 1322 Old Bridge Rd
- 1819 Beachwood Dr
- 21 E Mariana Ave
- 108 Powell Creek Cir
- 104 Ollie St
- 1734 Ixora Dr
- 106/108 Ollie St
- 1718 Ixora Dr
- 321 Little Grove Ln
- 318 Little Grove Ln
- 1713 Ixora Dr
- 1730 Ixora Dr
- 1709 Ixora Dr
- 1727 Ixora Dr
- 109 Ollie St
- 1707 Ixora Dr
- 1702 Ixora Dr
- 317 Little Grove Ln
- 314 Little Grove Ln
- 1731 Ixora Dr
- 122 Holland St
- 124 Holland St
- 1713/1715 Ixora Dr
- 1705 Ixora Dr