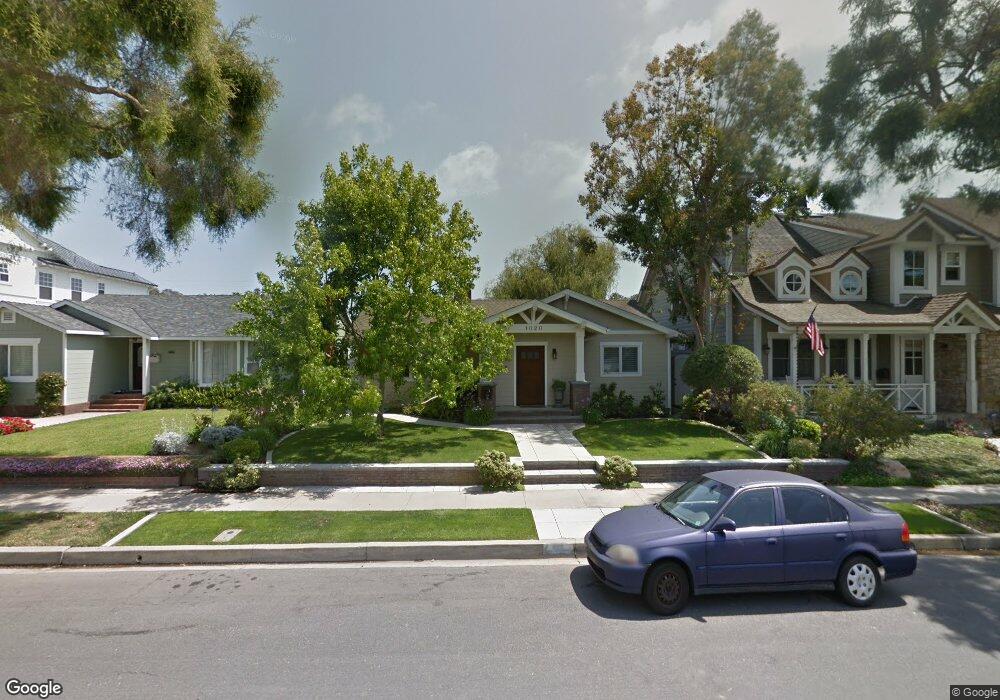
1020 13th St Huntington Beach, CA 92648
Estimated Value: $1,549,000 - $1,943,000
3
Beds
2
Baths
1,804
Sq Ft
$937/Sq Ft
Est. Value
About This Home
This home is located at 1020 13th St, Huntington Beach, CA 92648 and is currently estimated at $1,690,149, approximately $936 per square foot. 1020 13th St is a home located in Orange County with nearby schools including Agnes L. Smith Elementary, Ethel Dwyer Middle, and Huntington Beach High School.
Ownership History
Date
Name
Owned For
Owner Type
Purchase Details
Closed on
Oct 20, 2025
Sold by
Cook Pamela
Bought by
Cook Living Trust and Cook
Current Estimated Value
Purchase Details
Closed on
Jun 16, 2010
Sold by
Cook Pamela L
Bought by
Cook Pamela
Home Financials for this Owner
Home Financials are based on the most recent Mortgage that was taken out on this home.
Original Mortgage
$417,000
Interest Rate
4.82%
Mortgage Type
New Conventional
Purchase Details
Closed on
Oct 5, 2009
Sold by
Demond Todd
Bought by
Cook Pamela L
Purchase Details
Closed on
Sep 14, 1994
Sold by
Jordan Scott Cooper and Kronfeld Mercedes Charlotte
Bought by
Demond Todd Phillip and Cook Pam
Home Financials for this Owner
Home Financials are based on the most recent Mortgage that was taken out on this home.
Original Mortgage
$237,000
Interest Rate
8.7%
Create a Home Valuation Report for This Property
The Home Valuation Report is an in-depth analysis detailing your home's value as well as a comparison with similar homes in the area
Home Values in the Area
Average Home Value in this Area
Purchase History
| Date | Buyer | Sale Price | Title Company |
|---|---|---|---|
| Cook Living Trust | -- | None Listed On Document | |
| Cook Pamela | -- | First American Title | |
| Cook Pamela L | -- | None Available | |
| Demond Todd Phillip | $337,000 | Gateway Title Company |
Source: Public Records
Mortgage History
| Date | Status | Borrower | Loan Amount |
|---|---|---|---|
| Previous Owner | Cook Pamela | $417,000 | |
| Previous Owner | Demond Todd Phillip | $237,000 |
Source: Public Records
Tax History Compared to Growth
Tax History
| Year | Tax Paid | Tax Assessment Tax Assessment Total Assessment is a certain percentage of the fair market value that is determined by local assessors to be the total taxable value of land and additions on the property. | Land | Improvement |
|---|---|---|---|---|
| 2025 | $7,072 | $618,038 | $448,234 | $169,804 |
| 2024 | $7,072 | $605,920 | $439,445 | $166,475 |
| 2023 | $6,914 | $594,040 | $430,829 | $163,211 |
| 2022 | $6,733 | $582,393 | $422,382 | $160,011 |
| 2021 | $6,609 | $570,974 | $414,100 | $156,874 |
| 2020 | $6,566 | $565,120 | $409,854 | $155,266 |
| 2019 | $6,488 | $554,040 | $401,818 | $152,222 |
| 2018 | $6,389 | $543,177 | $393,939 | $149,238 |
| 2017 | $6,304 | $532,527 | $386,215 | $146,312 |
| 2016 | $5,965 | $516,427 | $378,642 | $137,785 |
| 2015 | $5,908 | $508,670 | $372,954 | $135,716 |
| 2014 | $5,785 | $498,706 | $365,648 | $133,058 |
Source: Public Records
Map
Nearby Homes