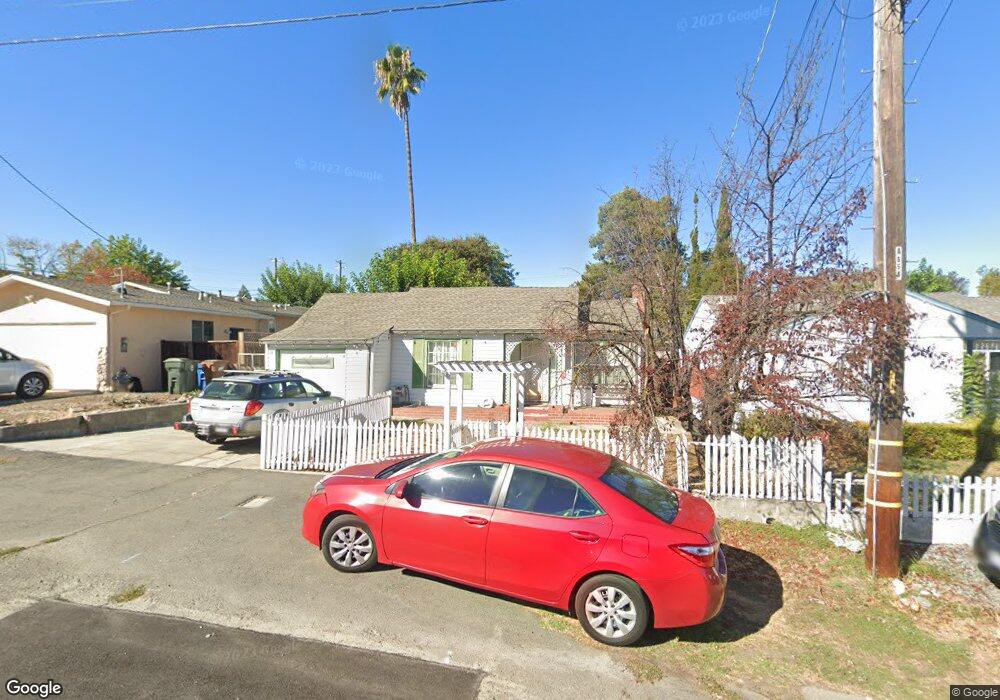
1021 Delacy Ave Martinez, CA 94553
Mountain View NeighborhoodEstimated Value: $588,064 - $729,000
3
Beds
1
Bath
1,095
Sq Ft
$595/Sq Ft
Est. Value
About This Home
This home is located at 1021 Delacy Ave, Martinez, CA 94553 and is currently estimated at $651,766, approximately $595 per square foot. 1021 Delacy Ave is a home located in Contra Costa County with nearby schools including Morello Park Elementary School, Martinez Junior High School, and Alhambra Senior High School.
Ownership History
Date
Name
Owned For
Owner Type
Purchase Details
Closed on
Jun 17, 2004
Sold by
Talosig Chelsea
Bought by
Talosig Joseph
Current Estimated Value
Home Financials for this Owner
Home Financials are based on the most recent Mortgage that was taken out on this home.
Original Mortgage
$269,100
Outstanding Balance
$128,182
Interest Rate
5.62%
Mortgage Type
Purchase Money Mortgage
Estimated Equity
$523,584
Purchase Details
Closed on
Dec 13, 2001
Sold by
Miller Dan 4 and Miller Sharon L
Bought by
Talosig Joseph and Talosig Chelsea
Home Financials for this Owner
Home Financials are based on the most recent Mortgage that was taken out on this home.
Original Mortgage
$210,260
Interest Rate
6.73%
Mortgage Type
Purchase Money Mortgage
Purchase Details
Closed on
Mar 7, 1996
Sold by
Goren Jesse L and Goren Vanessa L
Bought by
Miller Dan J and Miller Sharon L
Home Financials for this Owner
Home Financials are based on the most recent Mortgage that was taken out on this home.
Original Mortgage
$138,700
Interest Rate
7.01%
Mortgage Type
Purchase Money Mortgage
Create a Home Valuation Report for This Property
The Home Valuation Report is an in-depth analysis detailing your home's value as well as a comparison with similar homes in the area
Home Values in the Area
Average Home Value in this Area
Purchase History
| Date | Buyer | Sale Price | Title Company |
|---|---|---|---|
| Talosig Joseph | -- | Placer Title | |
| Talosig Joseph | $263,000 | Old Republic Title Company | |
| Miller Dan J | $143,000 | Commonwealth Land Title Co |
Source: Public Records
Mortgage History
| Date | Status | Borrower | Loan Amount |
|---|---|---|---|
| Open | Talosig Joseph | $269,100 | |
| Closed | Talosig Joseph | $210,260 | |
| Previous Owner | Miller Dan J | $138,700 | |
| Closed | Talosig Joseph | $52,560 |
Source: Public Records
Tax History Compared to Growth
Tax History
| Year | Tax Paid | Tax Assessment Tax Assessment Total Assessment is a certain percentage of the fair market value that is determined by local assessors to be the total taxable value of land and additions on the property. | Land | Improvement |
|---|---|---|---|---|
| 2025 | $5,401 | $388,209 | $257,483 | $130,726 |
| 2024 | $5,401 | $380,598 | $252,435 | $128,163 |
| 2023 | $5,256 | $373,136 | $247,486 | $125,650 |
| 2022 | $5,108 | $365,821 | $242,634 | $123,187 |
| 2021 | $4,956 | $358,649 | $237,877 | $120,772 |
| 2019 | $4,766 | $348,013 | $230,822 | $117,191 |
| 2018 | $4,564 | $341,191 | $226,297 | $114,894 |
| 2017 | $4,366 | $322,500 | $213,900 | $108,600 |
| 2016 | $3,920 | $302,500 | $200,634 | $101,866 |
| 2015 | $3,297 | $243,500 | $161,502 | $81,998 |
| 2014 | $2,936 | $210,000 | $139,283 | $70,717 |
Source: Public Records
Map
Nearby Homes
- 1115 Vine Ave
- 2910 Almond St
- 1111 Palm Ave
- 0 Palm Ave
- 2555 Orange St
- 3014 Pacheco Blvd
- 2610 Pacheco Blvd
- 2411 Pinon Ct
- 2350 W Shell Ave
- 300 Lodgepole Ct
- 2131 Pomona Ave
- 289 Crestview Ave
- 415 Orchard View Ave
- 830 Westview Ct
- 121 St Nazaire Ct
- 116 St Malo Ct
- 150 Farm Ln
- 186 Farm Ln
- 221 Village Place
- 3102 Pine St
- 1031 Delacy Ave
- 1011 Delacy Ave
- 1041 Delacy Ave
- 2825 Leslie Ave
- 1020 Veale Ave
- 1030 Veale Ave
- 1010 Veale Ave
- 1036 Veale Ave
- 1051 Delacy Ave
- 2805 Leslie Ave
- 1040 Veale Ave
- 1010 Delacy Ave
- 1000 Delacy Ave
- 1030 Delacy Ave
- 1050 Veale Ave
- 1061 Delacy Ave
- 2812 Leslie Ave
- 1040 Delacy Ave
- 2820 Leslie Ave
- 2806 Leslie Ave