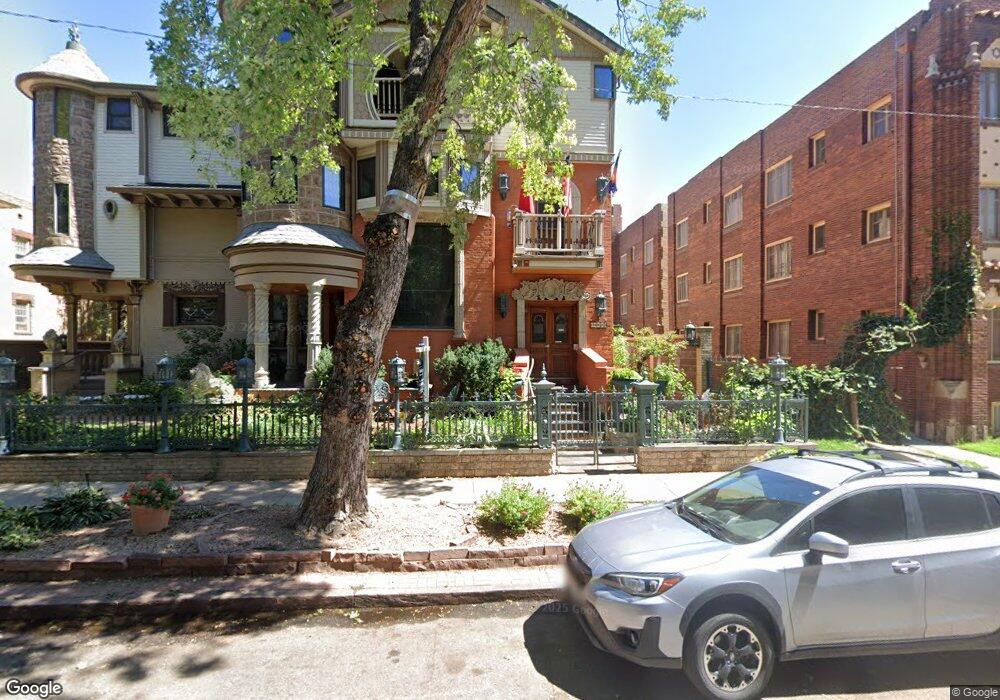
1022 N Pearl St Unit 203 Denver, CO 80203
Capitol Hill NeighborhoodEstimated Value: $483,088 - $577,000
2
Beds
2
Baths
1,251
Sq Ft
$423/Sq Ft
Est. Value
About This Home
This home is located at 1022 N Pearl St Unit 203, Denver, CO 80203 and is currently estimated at $529,022, approximately $422 per square foot. 1022 N Pearl St Unit 203 is a home located in Denver County with nearby schools including Dora Moore ECE-8 School, Morey Middle School, and East High School.
Ownership History
Date
Name
Owned For
Owner Type
Purchase Details
Closed on
Feb 27, 2018
Sold by
Bruckner Christina Clark
Bought by
Safran Miroslay and Safran Claudia
Current Estimated Value
Purchase Details
Closed on
Jan 27, 2012
Sold by
Bruckner William Joseph and Bruckner Lucy Clark
Bought by
Bruckner Christina Clark
Home Financials for this Owner
Home Financials are based on the most recent Mortgage that was taken out on this home.
Original Mortgage
$320,000
Interest Rate
3.95%
Mortgage Type
Seller Take Back
Purchase Details
Closed on
Sep 9, 2011
Sold by
Payne Amy and Payne Mike
Bought by
Bruckner William Joseph and Bruckner Lucy Clark
Purchase Details
Closed on
Apr 18, 2008
Sold by
Pearl Street Victoriana Llc
Bought by
Payne Mike and Payne Amy
Home Financials for this Owner
Home Financials are based on the most recent Mortgage that was taken out on this home.
Original Mortgage
$270,000
Interest Rate
6.11%
Mortgage Type
Purchase Money Mortgage
Create a Home Valuation Report for This Property
The Home Valuation Report is an in-depth analysis detailing your home's value as well as a comparison with similar homes in the area
Home Values in the Area
Average Home Value in this Area
Purchase History
| Date | Buyer | Sale Price | Title Company |
|---|---|---|---|
| Safran Miroslay | $465,000 | Canyon Title | |
| Bruckner Christina Clark | -- | None Available | |
| Bruckner William Joseph | $342,000 | Enterprise Title Lllp | |
| Payne Mike | $400,000 | Fahtco |
Source: Public Records
Mortgage History
| Date | Status | Borrower | Loan Amount |
|---|---|---|---|
| Previous Owner | Bruckner Christina Clark | $320,000 | |
| Previous Owner | Payne Mike | $270,000 |
Source: Public Records
Tax History Compared to Growth
Tax History
| Year | Tax Paid | Tax Assessment Tax Assessment Total Assessment is a certain percentage of the fair market value that is determined by local assessors to be the total taxable value of land and additions on the property. | Land | Improvement |
|---|---|---|---|---|
| 2024 | $2,506 | $31,640 | $740 | $30,900 |
| 2023 | $2,452 | $31,640 | $740 | $30,900 |
| 2022 | $2,297 | $28,880 | $4,590 | $24,290 |
| 2021 | $2,218 | $29,720 | $4,730 | $24,990 |
| 2020 | $2,328 | $31,370 | $4,430 | $26,940 |
| 2019 | $2,262 | $31,370 | $4,430 | $26,940 |
| 2018 | $2,606 | $33,680 | $4,160 | $29,520 |
| 2017 | $2,598 | $33,680 | $4,160 | $29,520 |
| 2016 | $3,152 | $38,650 | $4,275 | $34,375 |
| 2015 | $3,020 | $38,650 | $4,275 | $34,375 |
| 2014 | $3,182 | $38,310 | $2,778 | $35,532 |
Source: Public Records
Map
Nearby Homes
- 555 E 10th Ave Unit 114
- 555 E 10th Ave Unit 10
- 555 E 10th Ave Unit 15
- 555 E 10th Ave Unit 3
- 960 N Pennsylvania St Unit 16
- 500 E 11th Ave Unit 102
- 500 E 11th Ave Unit 101
- 500 E 11th Ave Unit 201
- 500 E 11th Ave Unit 203
- 500 E 11th Ave Unit 205
- 1060 N Washington St Unit 1A
- 963 N Logan St Unit 11
- 963 N Logan St Unit 23
- 946 N Washington St
- 1063 N Clarkson St Unit 12
- 1130 N Pennsylvania St Unit 307
- 1130 N Pennsylvania St Unit 306
- 1045 N Clarkson St Unit 102
- 1113 N Washington St
- 1125 N Washington St Unit 501
- 1022 N Pearl St Unit 301
- 1022 N Pearl St Unit 202
- 1022 N Pearl St Unit 101
- 1022 N Pearl St Unit 303
- 1022 Pearl St Unit 302
- 1022 Pearl St
- 1022 Pearl St Unit 203
- 1022 Pearl St Unit 202
- 1022 Pearl St Unit 102
- 1022 Pearl St Unit 101
- 1022 Pearl St
- 1022 Pearl St Unit 301
- 1022 Pearl St Unit 303
- 1030 N Pearl St
- 607 E 10th Ave
- 615 E 10th Ave
- 1027 Washington St
- 1616-1630 Pearl St
- 1050 N Pearl St Unit 303
- 1035 Pearl St