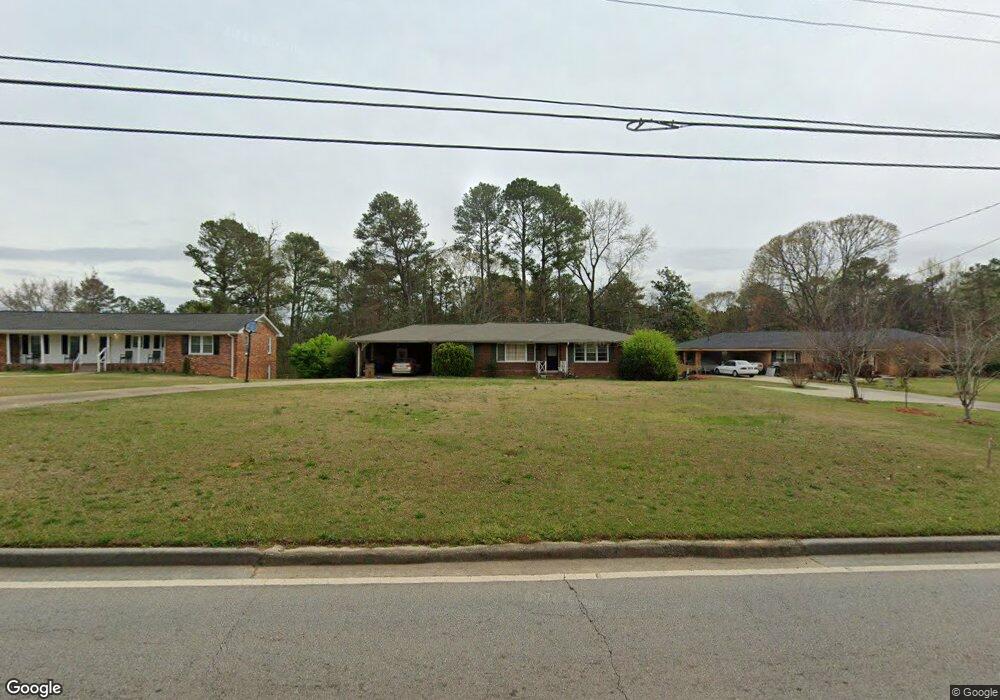
1023 Blair Bridge Rd Austell, GA 30168
Estimated Value: $225,375 - $281,000
3
Beds
2
Baths
1,390
Sq Ft
$188/Sq Ft
Est. Value
About This Home
This home is located at 1023 Blair Bridge Rd, Austell, GA 30168 and is currently estimated at $260,844, approximately $187 per square foot. 1023 Blair Bridge Rd is a home located in Cobb County with nearby schools including Bryant Elementary School, Lindley Middle School, and Pebblebrook High School.
Ownership History
Date
Name
Owned For
Owner Type
Purchase Details
Closed on
Sep 15, 2018
Sold by
Banks Jonathon
Bought by
Banks Franklin Deron
Current Estimated Value
Purchase Details
Closed on
Sep 4, 2008
Sold by
Hud & Housing Of Urban Dev
Bought by
Banks Franklin and Banks Jonathon
Home Financials for this Owner
Home Financials are based on the most recent Mortgage that was taken out on this home.
Original Mortgage
$51,996
Interest Rate
6.61%
Mortgage Type
New Conventional
Purchase Details
Closed on
Jan 2, 2008
Sold by
Citimortgage Inc
Bought by
Hud & Housing Of Urban Dev
Purchase Details
Closed on
Apr 6, 2001
Sold by
Macias Jose
Bought by
Oliver Joyce C
Home Financials for this Owner
Home Financials are based on the most recent Mortgage that was taken out on this home.
Original Mortgage
$111,200
Interest Rate
7.11%
Mortgage Type
FHA
Create a Home Valuation Report for This Property
The Home Valuation Report is an in-depth analysis detailing your home's value as well as a comparison with similar homes in the area
Home Values in the Area
Average Home Value in this Area
Purchase History
| Date | Buyer | Sale Price | Title Company |
|---|---|---|---|
| Banks Franklin Deron | -- | -- | |
| Banks Franklin | $69,000 | -- | |
| Hud & Housing Of Urban Dev | -- | -- | |
| Citimortgage Inc | $114,102 | -- | |
| Oliver Joyce C | $113,400 | -- |
Source: Public Records
Mortgage History
| Date | Status | Borrower | Loan Amount |
|---|---|---|---|
| Previous Owner | Banks Franklin | $51,996 | |
| Previous Owner | Oliver Joyce C | $111,200 |
Source: Public Records
Tax History Compared to Growth
Tax History
| Year | Tax Paid | Tax Assessment Tax Assessment Total Assessment is a certain percentage of the fair market value that is determined by local assessors to be the total taxable value of land and additions on the property. | Land | Improvement |
|---|---|---|---|---|
| 2025 | $2,478 | $82,236 | $27,208 | $55,028 |
| 2024 | $2,479 | $82,236 | $27,208 | $55,028 |
| 2023 | $1,862 | $61,744 | $25,060 | $36,684 |
| 2022 | $1,678 | $55,300 | $18,616 | $36,684 |
| 2021 | $1,407 | $46,356 | $15,036 | $31,320 |
| 2020 | $1,277 | $42,060 | $10,740 | $31,320 |
| 2019 | $1,277 | $42,060 | $10,740 | $31,320 |
| 2018 | $830 | $27,352 | $5,728 | $21,624 |
| 2017 | $786 | $27,352 | $5,728 | $21,624 |
| 2016 | $735 | $25,552 | $5,368 | $20,184 |
| 2015 | $658 | $22,324 | $3,580 | $18,744 |
| 2014 | $592 | $19,916 | $0 | $0 |
Source: Public Records
Map
Nearby Homes
- 1142 Hembree Ln
- 0 Hembree Ln Unit 10633605
- 00 Hembree Ln
- 7098 Pleasant Dr
- 817 Revena Dr
- 840 Revena Dr
- 7063 Pleasant Dr
- 7067 Pleasant Dr
- 1086 S Gordon Rd
- 760 Wade Farm Dr
- 1243 Blairs Pointe Dr Unit 3
- 6609 Crossing Creek Point
- 761 Knox Springs Rd
- 1195 Park Center Cir
- 1199 Park Center Cir
- 1203 Park Center Cir
- 7254 Silverton Trail
- 1211 Ling Way
- 1033 Blair Bridge Rd
- 1013 Blair Bridge Rd
- 1045 Blair Bridge Rd
- 1003 Blair Bridge Rd
- 1050 Blair Bridge Rd
- 6870 William Rd
- 1030 Blair Bridge Rd
- 991 Blair Bridge Rd
- 6890 William Rd
- 6900 William Rd
- 1064 Blair Bridge Rd
- 1051 Blair Bridge Rd
- 1006 Blair Bridge Rd
- 0 William Rd Unit 10229576
- 0 William Rd Unit 7309198
- 0 William Rd
- 6920 William Rd
- 1067 Blair Bridge Rd
- 6860 Myra Ln
- 6850 Myra Ln