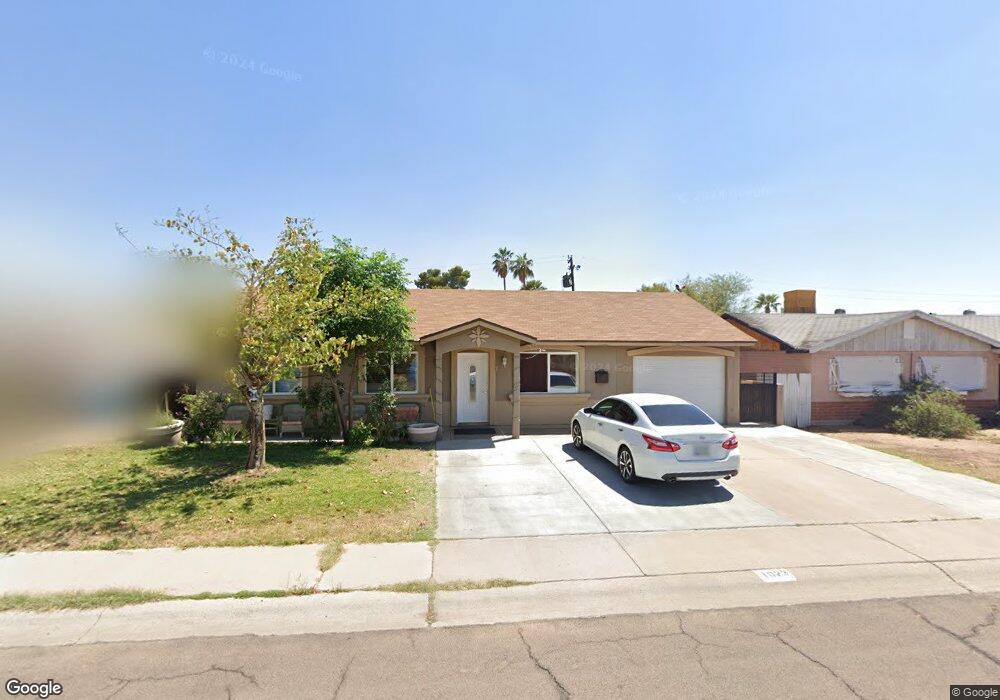
1023 E Las Palmaritas Dr Phoenix, AZ 85020
North Central NeighborhoodEstimated Value: $378,347 - $456,000
--
Bed
2
Baths
1,092
Sq Ft
$391/Sq Ft
Est. Value
About This Home
This home is located at 1023 E Las Palmaritas Dr, Phoenix, AZ 85020 and is currently estimated at $426,587, approximately $390 per square foot. 1023 E Las Palmaritas Dr is a home located in Maricopa County with nearby schools including Desert View Elementary School, Royal Palm Middle School, and Sunnyslope High School.
Ownership History
Date
Name
Owned For
Owner Type
Purchase Details
Closed on
Feb 25, 1995
Sold by
Hoadley Ernest J
Bought by
Torres Jose Luis and Torres Gloria Cardenas
Current Estimated Value
Home Financials for this Owner
Home Financials are based on the most recent Mortgage that was taken out on this home.
Original Mortgage
$62,080
Interest Rate
8.5%
Mortgage Type
New Conventional
Purchase Details
Closed on
Jun 30, 1994
Sold by
Lindell James W
Bought by
Hoadley Ernest J
Home Financials for this Owner
Home Financials are based on the most recent Mortgage that was taken out on this home.
Original Mortgage
$51,300
Interest Rate
8.53%
Mortgage Type
New Conventional
Create a Home Valuation Report for This Property
The Home Valuation Report is an in-depth analysis detailing your home's value as well as a comparison with similar homes in the area
Home Values in the Area
Average Home Value in this Area
Purchase History
| Date | Buyer | Sale Price | Title Company |
|---|---|---|---|
| Torres Jose Luis | $64,000 | Transamerica Title Ins Co | |
| Hoadley Ernest J | $57,000 | Grand Canyon Title Agency In | |
| Lindell James W | -- | Grand Canyon Title Agency In | |
| Lindell James W | -- | Grand Canyon Title Agency In |
Source: Public Records
Mortgage History
| Date | Status | Borrower | Loan Amount |
|---|---|---|---|
| Closed | Torres Jose Luis | $62,080 | |
| Previous Owner | Hoadley Ernest J | $51,300 |
Source: Public Records
Tax History Compared to Growth
Tax History
| Year | Tax Paid | Tax Assessment Tax Assessment Total Assessment is a certain percentage of the fair market value that is determined by local assessors to be the total taxable value of land and additions on the property. | Land | Improvement |
|---|---|---|---|---|
| 2025 | $1,750 | $13,768 | -- | -- |
| 2024 | $1,653 | $13,113 | -- | -- |
| 2023 | $1,653 | $32,860 | $6,570 | $26,290 |
| 2022 | $1,396 | $24,410 | $4,880 | $19,530 |
| 2021 | $1,431 | $21,900 | $4,380 | $17,520 |
| 2020 | $1,393 | $20,160 | $4,030 | $16,130 |
| 2019 | $1,367 | $17,830 | $3,560 | $14,270 |
| 2018 | $1,328 | $16,780 | $3,350 | $13,430 |
| 2017 | $1,325 | $12,580 | $2,510 | $10,070 |
| 2016 | $1,301 | $11,620 | $2,320 | $9,300 |
| 2015 | $1,207 | $11,000 | $2,200 | $8,800 |
Source: Public Records
Map
Nearby Homes
- 8216 N 9th St
- 8112 N 10th Place
- 8050 N 11th Place
- 1002 E Butler Dr
- 833 E Butler Dr
- 1214 E Las Palmaritas Dr
- 1130 E Butler Dr Unit B4
- 1130 E Butler Dr Unit A1
- 1028 E Manzanita Dr
- 1214 E Butler Dr
- 1114 E Orchid Ln
- 8149 N 13th Place
- 8436 N 13th Place
- 8220 N 14th St Unit 1
- 1340 E Las Palmaritas Dr
- 1066 E Pueblo Rd Unit 15C
- 750 E Northern Ave Unit 1094
- 750 E Northern Ave Unit 2143
- 750 E Northern Ave Unit 1055
- 750 E Northern Ave Unit 1069
- 1027 E Las Palmaritas Dr
- 1017 E Las Palmaritas Dr
- 1024 E El Camino Dr
- 1028 E El Camino Dr
- 1033 E Las Palmaritas Dr
- 1013 E Las Palmaritas Dr
- 1018 E El Camino Dr
- 1024 E Las Palmaritas Dr
- 1018 E Las Palmaritas Dr
- 1028 E Las Palmaritas Dr
- 1034 E El Camino Dr
- 1014 E El Camino Dr
- 1014 E Las Palmaritas Dr
- 1037 E Las Palmaritas Dr
- 1007 E Las Palmaritas Dr
- 1034 E Las Palmaritas Dr
- 1038 E El Camino Dr
- 1008 E El Camino Dr
- 1008 E Las Palmaritas Dr
- 1038 E Las Palmaritas Dr