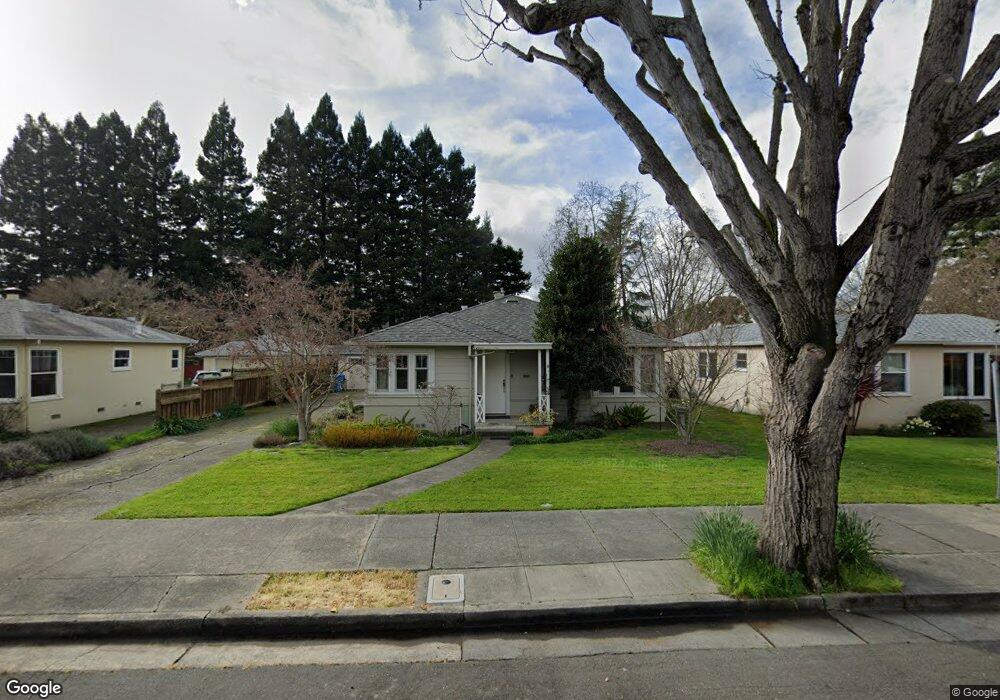
1023 Stewart St Santa Rosa, CA 95404
Junior College NeighborhoodEstimated Value: $727,731 - $888,000
3
Beds
2
Baths
1,413
Sq Ft
$596/Sq Ft
Est. Value
About This Home
This home is located at 1023 Stewart St, Santa Rosa, CA 95404 and is currently estimated at $841,933, approximately $595 per square foot. 1023 Stewart St is a home located in Sonoma County with nearby schools including Proctor Terrace Elementary School, Santa Rosa Middle School, and Santa Rosa High School.
Ownership History
Date
Name
Owned For
Owner Type
Purchase Details
Closed on
Jul 16, 2015
Sold by
Babcock Thomas W and Wright Petrilla A
Bought by
Wright Petrilla A and Babcock Thomas W
Current Estimated Value
Home Financials for this Owner
Home Financials are based on the most recent Mortgage that was taken out on this home.
Original Mortgage
$75,500
Outstanding Balance
$29,214
Interest Rate
3.85%
Mortgage Type
New Conventional
Estimated Equity
$812,719
Purchase Details
Closed on
Jan 30, 1995
Sold by
Clark Sue M and Eifert Ruth H
Bought by
Babcock Thomas W and Wright Petrilla A
Home Financials for this Owner
Home Financials are based on the most recent Mortgage that was taken out on this home.
Original Mortgage
$174,800
Interest Rate
8.75%
Create a Home Valuation Report for This Property
The Home Valuation Report is an in-depth analysis detailing your home's value as well as a comparison with similar homes in the area
Home Values in the Area
Average Home Value in this Area
Purchase History
| Date | Buyer | Sale Price | Title Company |
|---|---|---|---|
| Wright Petrilla A | -- | Fidelity National Title Co | |
| Babcock Thomas W | $184,000 | Chicago Title Company |
Source: Public Records
Mortgage History
| Date | Status | Borrower | Loan Amount |
|---|---|---|---|
| Open | Wright Petrilla A | $75,500 | |
| Closed | Babcock Thomas W | $174,800 |
Source: Public Records
Tax History Compared to Growth
Tax History
| Year | Tax Paid | Tax Assessment Tax Assessment Total Assessment is a certain percentage of the fair market value that is determined by local assessors to be the total taxable value of land and additions on the property. | Land | Improvement |
|---|---|---|---|---|
| 2025 | $3,414 | $306,100 | $124,769 | $181,331 |
| 2024 | $3,414 | $300,099 | $122,323 | $177,776 |
| 2023 | $3,414 | $294,216 | $119,925 | $174,291 |
| 2022 | $3,151 | $288,448 | $117,574 | $170,874 |
| 2021 | $3,111 | $282,793 | $115,269 | $167,524 |
| 2020 | $3,103 | $279,895 | $114,088 | $165,807 |
| 2019 | $3,085 | $274,407 | $111,851 | $162,556 |
| 2018 | $3,066 | $269,027 | $109,658 | $159,369 |
| 2017 | $3,009 | $263,753 | $107,508 | $156,245 |
| 2016 | $2,981 | $258,582 | $105,400 | $153,182 |
| 2015 | $2,892 | $254,699 | $103,817 | $150,882 |
| 2014 | $2,714 | $249,711 | $101,784 | $147,927 |
Source: Public Records
Map
Nearby Homes
- 1240 North St
- 1320 North St Unit 33
- 642 Wright St
- 804 Beaver St
- 763 Beaver St
- 722 Beaver St
- 743 Beaver St
- 1158 Humboldt St
- 1805 Austin Way
- 726 Orchard St
- 722 Orchard St
- 1690 Beaver St
- 705 College Ave
- 840 5th St
- 1404 Slater St
- 109 Alderbrook Dr
- 265 Doyle Park Dr
- 1640 Julianne Place
- 266 Doyle Park Dr
- 810 7th St Unit 23
- 1017 Stewart St
- 1029 Stewart St
- 1140 Spencer Ave
- 1009 Stewart St
- 1148 Spencer Ave
- 1132 Spencer Ave
- 1102 North St
- 1125 15th St
- 1001 Stewart St
- 1119 15th St
- 1022 Stewart St
- 1018 Stewart St
- 1014 Stewart St
- 1026 Stewart St
- 1129 Murray Ct
- 1133 Spencer Ave
- 1010 Stewart St
- 1000 Stewart St
- 1030 Stewart St
- 1232 North St