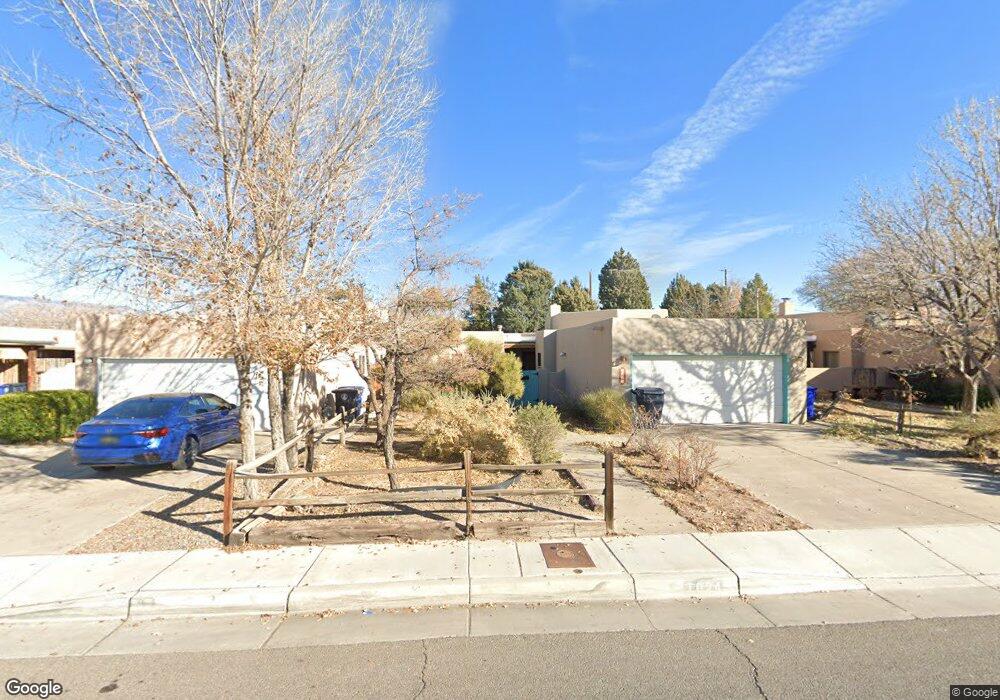
1024 Stanford Dr NE Albuquerque, NM 87106
North Campus NeighborhoodEstimated Value: $308,000 - $454,000
3
Beds
2
Baths
1,662
Sq Ft
$223/Sq Ft
Est. Value
About This Home
This home is located at 1024 Stanford Dr NE, Albuquerque, NM 87106 and is currently estimated at $371,203, approximately $223 per square foot. 1024 Stanford Dr NE is a home located in Bernalillo County with nearby schools including Monte Vista Elementary School, Jefferson Middle School, and Albuquerque High School.
Ownership History
Date
Name
Owned For
Owner Type
Purchase Details
Closed on
Jun 18, 2021
Sold by
Fetner Robert H and Fetner Jean
Bought by
Fetner Robert H and Fetner Jean
Current Estimated Value
Purchase Details
Closed on
Jun 22, 2020
Sold by
Fetner Jean L
Bought by
Fetner Jean L and Fetner Robert H
Purchase Details
Closed on
Jan 23, 2003
Sold by
Brooks William M and Olander Jean L
Bought by
Olander Jean L
Create a Home Valuation Report for This Property
The Home Valuation Report is an in-depth analysis detailing your home's value as well as a comparison with similar homes in the area
Home Values in the Area
Average Home Value in this Area
Purchase History
| Date | Buyer | Sale Price | Title Company |
|---|---|---|---|
| Fetner Robert H | -- | None Available | |
| Fetner Jean L | -- | None Available | |
| Olander Jean L | -- | -- |
Source: Public Records
Tax History Compared to Growth
Tax History
| Year | Tax Paid | Tax Assessment Tax Assessment Total Assessment is a certain percentage of the fair market value that is determined by local assessors to be the total taxable value of land and additions on the property. | Land | Improvement |
|---|---|---|---|---|
| 2025 | $3,735 | $91,186 | $20,931 | $70,255 |
| 2024 | $3,735 | $88,530 | $20,321 | $68,209 |
| 2023 | $3,673 | $85,952 | $19,730 | $66,222 |
| 2022 | $3,549 | $83,449 | $19,155 | $64,294 |
| 2021 | $3,430 | $81,018 | $18,597 | $62,421 |
| 2020 | $3,374 | $78,659 | $18,056 | $60,603 |
| 2019 | $3,275 | $76,368 | $17,530 | $58,838 |
| 2018 | $3,158 | $76,368 | $17,530 | $58,838 |
| 2017 | $3,061 | $74,145 | $17,020 | $57,125 |
| 2016 | $2,973 | $69,889 | $16,043 | $53,846 |
| 2015 | $67,854 | $67,854 | $15,576 | $52,278 |
| 2014 | $2,712 | $65,877 | $15,122 | $50,755 |
| 2013 | -- | $63,959 | $14,682 | $49,277 |
Source: Public Records
Map
Nearby Homes
- 1026 Vassar Dr NE
- 900 Vassar Dr NE
- 1237 Princeton Dr NE
- 619 Girard Blvd NE
- 610 Dartmouth Dr NE
- 717 Lafayette Dr NE
- 2316 Hannett Ave NE
- 1401 Cornell Dr NE
- 1228 Lafayette Dr NE
- 1220 Calle Del Sol NE
- 1509 Harvard Ct NE
- 418 Lafayette Place NE
- 3210 Roma Ave NE
- 1405 Sigma Chi Rd NE
- 229 Dartmouth Dr NE
- 320 Wellesley Place NE
- 2615 Vista Larga Ave NE
- 1521 Dartmouth Dr NE
- 3600 MacKland Ave NE
- 2702 Morrow Rd NE
- 1028 Stanford Dr NE
- 1016 Stanford Dr NE
- 1032 Stanford Dr NE
- 1023 Columbia Dr NE
- 1012 Stanford Dr NE
- 1040 Stanford Dr NE
- 1033 Columbia Dr NE
- 1019 Columbia Dr NE
- 1008 Stanford Dr NE
- 1027 Columbia Dr NE
- 1015 Columbia Dr NE
- 1037 Columbia Dr NE
- 1009 Columbia Dr NE
- 1044 Stanford Dr NE
- 1006 Stanford Dr NE
- 1041 Columbia Dr NE
- 1000 Stanford Dr NE
- 1043 Columbia Dr NE
- 1001 Columbia Dr NE
- 1024 Columbia Dr NE