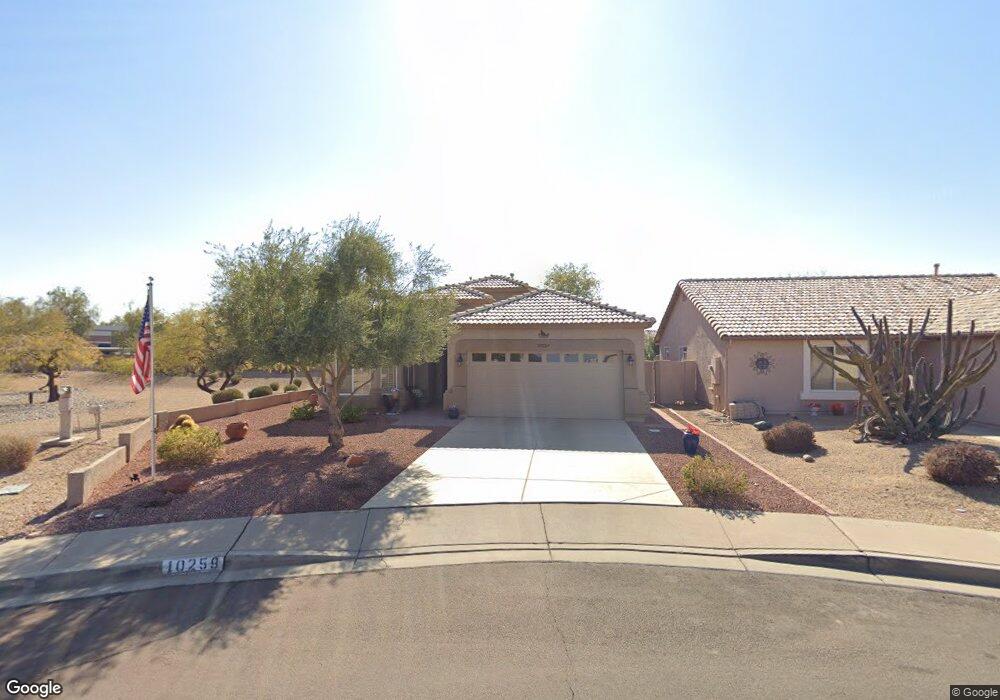
10259 W Mohawk Ln Peoria, AZ 85382
Estimated Value: $318,485 - $399,000
--
Bed
2
Baths
1,523
Sq Ft
$241/Sq Ft
Est. Value
About This Home
This home is located at 10259 W Mohawk Ln, Peoria, AZ 85382 and is currently estimated at $366,621, approximately $240 per square foot. 10259 W Mohawk Ln is a home located in Maricopa County with nearby schools including Parkridge Elementary School, Sunrise Mountain High School, and Guidepost Montessori at Peoria.
Ownership History
Date
Name
Owned For
Owner Type
Purchase Details
Closed on
Jun 24, 2020
Sold by
Mccord Mary Lynn
Bought by
Mccord Mary Lynn and Mary Lynn Mccord Revocable Tru
Current Estimated Value
Purchase Details
Closed on
Jan 24, 2003
Sold by
Mccord Mary Lynn
Bought by
Mccord Mary Lynn and Mccord Joseph J
Home Financials for this Owner
Home Financials are based on the most recent Mortgage that was taken out on this home.
Original Mortgage
$122,000
Outstanding Balance
$52,326
Interest Rate
5.97%
Estimated Equity
$314,295
Purchase Details
Closed on
Feb 22, 2000
Sold by
Lutes Ray and Lutes Pat
Bought by
Mccord Joseph J and Mccord Mary Lynn
Home Financials for this Owner
Home Financials are based on the most recent Mortgage that was taken out on this home.
Original Mortgage
$114,750
Interest Rate
8.34%
Mortgage Type
New Conventional
Purchase Details
Closed on
Nov 25, 1997
Sold by
Lennar Homes Of Arizona Inc
Bought by
Lutes Ray and Lutes Pat
Create a Home Valuation Report for This Property
The Home Valuation Report is an in-depth analysis detailing your home's value as well as a comparison with similar homes in the area
Home Values in the Area
Average Home Value in this Area
Purchase History
| Date | Buyer | Sale Price | Title Company |
|---|---|---|---|
| Mccord Mary Lynn | -- | None Available | |
| Mccord Mary Lynn | -- | Century Title Agency | |
| Mccord Mary Lynn | -- | Century Title Agency Inc | |
| Mccord Joseph J | $127,500 | Security Title Agency | |
| Lutes Ray | $117,150 | First Southwestern Title |
Source: Public Records
Mortgage History
| Date | Status | Borrower | Loan Amount |
|---|---|---|---|
| Open | Mccord Mary Lynn | $122,000 | |
| Closed | Mccord Joseph J | $114,750 |
Source: Public Records
Tax History Compared to Growth
Tax History
| Year | Tax Paid | Tax Assessment Tax Assessment Total Assessment is a certain percentage of the fair market value that is determined by local assessors to be the total taxable value of land and additions on the property. | Land | Improvement |
|---|---|---|---|---|
| 2025 | $1,456 | $18,061 | -- | -- |
| 2024 | $1,428 | $17,201 | -- | -- |
| 2023 | $1,428 | $26,550 | $5,310 | $21,240 |
| 2022 | $1,398 | $20,930 | $4,180 | $16,750 |
| 2021 | $1,489 | $20,030 | $4,000 | $16,030 |
| 2020 | $1,494 | $17,750 | $3,550 | $14,200 |
| 2019 | $1,438 | $16,880 | $3,370 | $13,510 |
| 2018 | $1,383 | $16,000 | $3,200 | $12,800 |
| 2017 | $1,384 | $13,900 | $2,780 | $11,120 |
| 2016 | $1,369 | $13,580 | $2,710 | $10,870 |
| 2015 | $1,278 | $13,000 | $2,600 | $10,400 |
Source: Public Records
Map
Nearby Homes
- 10344 W Burnett Rd
- 10347 W Mohawk Ln
- 10379 W Tonopah Dr
- 10368 W Ross Ave
- 10169 W Potter Dr
- 20615 N 105th Ave
- 20274 N 104th Ave
- 10528 W Potter Dr
- 20670 N 105th Dr
- 10630 W Mohawk Ln
- 20017 N 101st Ave
- 20640 N 100th Ln
- 10134 W Pine Springs Dr
- 20046 N Welk Dr
- 20769 N 106th Ln
- 20037 N Welk Dr
- 10129 W Pine Springs Dr
- 20018 N Lakeforest Dr
- 20360 N 106th Ln
- 19835 N 100th Dr
- 10263 W Mohawk Ln
- 10267 W Mohawk Ln
- 20605 N 102nd Ln
- 10319 W Mohawk Ln
- 20610 N 102nd Ln
- 20609 N 102nd Ln
- 10323 W Mohawk Ln
- 20614 N 102nd Ln
- 20609 N 103rd Ave
- 20613 N 102nd Ln
- 20618 N 102nd Ln
- 20613 N 103rd Ave
- 10327 W Mohawk Ln
- 20617 N 102nd Ln
- 20617 N 103rd Ave
- 20622 N 102nd Ln
- 20621 N 102nd Ln
- 20604 N 103rd Ave
- 20621 N 103rd Ave
- 20626 N 102nd Ln