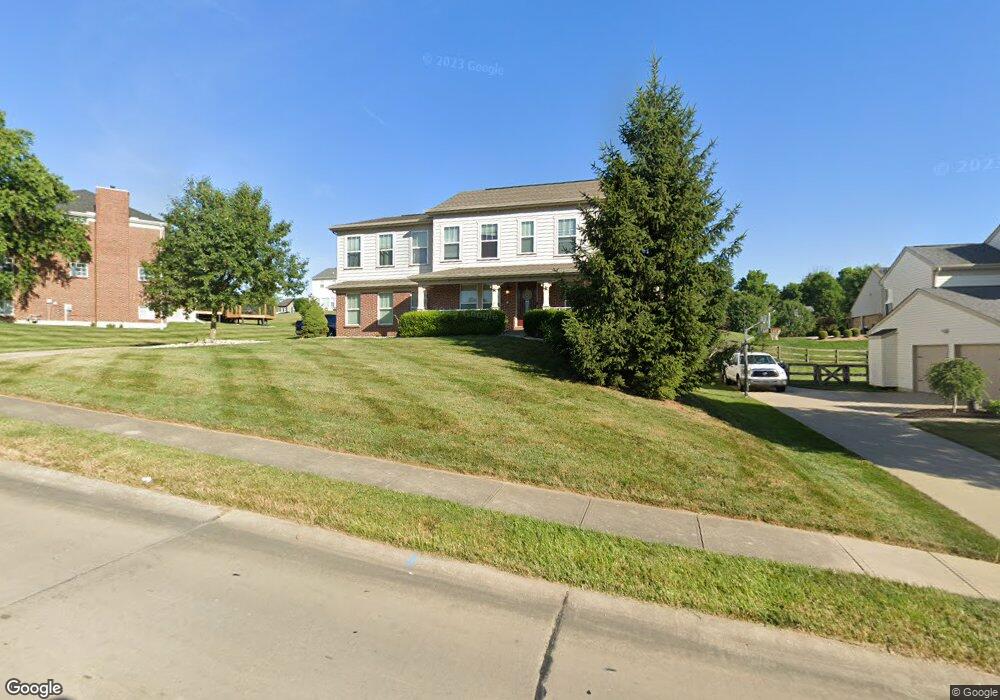
10271 Meadow Glen Dr Independence, KY 41051
Estimated Value: $415,000 - $437,000
4
Beds
3
Baths
2,961
Sq Ft
$143/Sq Ft
Est. Value
About This Home
This home is located at 10271 Meadow Glen Dr, Independence, KY 41051 and is currently estimated at $422,287, approximately $142 per square foot. 10271 Meadow Glen Dr is a home located in Kenton County with nearby schools including Simon Kenton High School, St. Cecilia Catholic School, and Zion Christian Academy.
Ownership History
Date
Name
Owned For
Owner Type
Purchase Details
Closed on
Dec 8, 2010
Sold by
Clifton Angela M
Bought by
Clifton David D
Current Estimated Value
Home Financials for this Owner
Home Financials are based on the most recent Mortgage that was taken out on this home.
Original Mortgage
$226,442
Outstanding Balance
$149,301
Interest Rate
4.18%
Mortgage Type
FHA
Estimated Equity
$272,986
Purchase Details
Closed on
May 6, 2008
Sold by
Fischer Single Family Homes Ii Llc
Bought by
Clifton Angela M and Clifton David D
Home Financials for this Owner
Home Financials are based on the most recent Mortgage that was taken out on this home.
Original Mortgage
$225,656
Interest Rate
5.82%
Mortgage Type
FHA
Purchase Details
Closed on
Mar 27, 2007
Sold by
Hasekoester Reese Llc
Bought by
Fischer Single Family Homes Ii Llc
Create a Home Valuation Report for This Property
The Home Valuation Report is an in-depth analysis detailing your home's value as well as a comparison with similar homes in the area
Home Values in the Area
Average Home Value in this Area
Purchase History
| Date | Buyer | Sale Price | Title Company |
|---|---|---|---|
| Clifton David D | -- | Prominent Title Agency Llc | |
| Clifton Angela M | $227,440 | Homestead Title Agency Ltd | |
| Fischer Single Family Homes Ii Llc | $41,000 | None Available |
Source: Public Records
Mortgage History
| Date | Status | Borrower | Loan Amount |
|---|---|---|---|
| Open | Clifton David D | $226,442 | |
| Closed | Clifton Angela M | $225,656 |
Source: Public Records
Tax History Compared to Growth
Tax History
| Year | Tax Paid | Tax Assessment Tax Assessment Total Assessment is a certain percentage of the fair market value that is determined by local assessors to be the total taxable value of land and additions on the property. | Land | Improvement |
|---|---|---|---|---|
| 2024 | $3,526 | $287,800 | $48,000 | $239,800 |
| 2023 | $3,632 | $287,800 | $48,000 | $239,800 |
| 2022 | $3,685 | $287,800 | $48,000 | $239,800 |
| 2021 | $3,740 | $287,800 | $48,000 | $239,800 |
| 2020 | $3,158 | $237,000 | $40,000 | $197,000 |
| 2019 | $3,167 | $237,000 | $40,000 | $197,000 |
| 2018 | $3,184 | $237,000 | $40,000 | $197,000 |
| 2017 | $3,096 | $237,000 | $40,000 | $197,000 |
| 2015 | $3,011 | $237,000 | $41,000 | $196,000 |
| 2014 | $2,969 | $237,000 | $41,000 | $196,000 |
Source: Public Records
Map
Nearby Homes
- 1373 Meadowrun Ln
- 1375 Grandarbor Cir
- 1381 Poplartree Place
- 10150 Meadow Glen Dr
- Cumberland Plan at Meadow Glen - Maple Street Collection
- Wesley Plan at Meadow Glen - Maple Street Collection
- 1355 Meadowcrest Cir
- 9972 Meadow Glen Dr
- 9947 Meadow Glen Dr
- 10323 Manassas Ct
- 10363 Canberra Dr
- 10311 Emancipation Place
- 10383 Lynchburg Dr
- 1365 Cairns Ct
- 10438 Canberra Dr
- 10444 Canberra Dr
- 10448 Canberra Dr
- 9831 Codyview Dr
- 10434 Sharpsburg Dr
- 114 Sylvan Dr
- 10271 Meadow Glen Dr Unit 14
- 10275 Meadow Glen Dr
- 10275 Meadow Glen Dr Unit 13
- 10267 Meadow Glen Dr
- 10267 Meadow Glen Dr Unit 15
- 10270 Highmeadow Ln
- 10274 Highmeadow Ln
- 10266 Highmeadow Ln
- 10266 Highmeadow Ln Unit 16
- 10270 Meadow Glen Dr
- 10270 Meadow Glen Dr Unit 89
- 10274 Meadow Glen Dr
- 10283 Meadow Glen Dr
- 10283 Meadow Glen Dr Unit 11
- 10278 Meadow Glen Dr
- 0 Meadow Glen Dr
- 10261 Meadow Glen Dr
- 10261 Meadow Glen Dr Unit 65
- 10260 Highmeadow Ln
- 10282 Highmeadow Ln