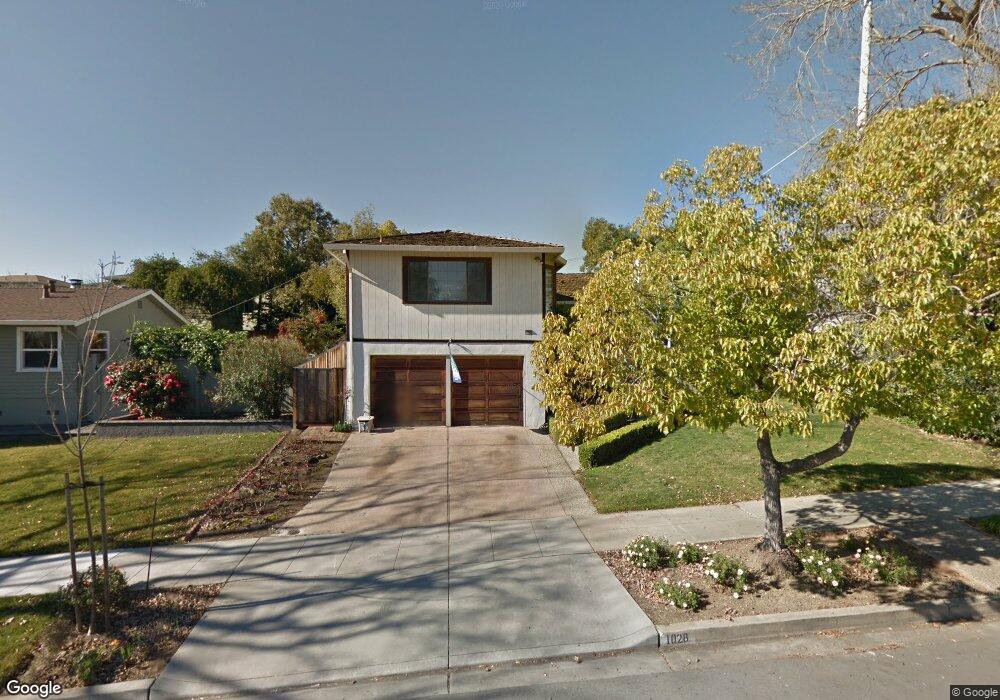
1028 Alameda de Las Pulgas Redwood City, CA 94061
Farm Hill NeighborhoodEstimated Value: $1,846,000 - $2,004,218
3
Beds
2
Baths
1,560
Sq Ft
$1,234/Sq Ft
Est. Value
About This Home
This home is located at 1028 Alameda de Las Pulgas, Redwood City, CA 94061 and is currently estimated at $1,924,555, approximately $1,233 per square foot. 1028 Alameda de Las Pulgas is a home located in San Mateo County with nearby schools including Roosevelt Elementary School, John F. Kennedy Middle School, and Woodside High School.
Ownership History
Date
Name
Owned For
Owner Type
Purchase Details
Closed on
Jun 24, 2021
Sold by
Rodondi James Joseph Jude and Rodondi Judith Lynne
Bought by
Rodondi 2021 Trust and Rodondi
Current Estimated Value
Purchase Details
Closed on
Jun 7, 2001
Sold by
Rogers Jon M and Rogers Joanna E
Bought by
Rodondi James Joseph Jude and Rodondi Judith Lynne
Home Financials for this Owner
Home Financials are based on the most recent Mortgage that was taken out on this home.
Original Mortgage
$260,000
Interest Rate
7.14%
Purchase Details
Closed on
Feb 3, 1997
Sold by
Jonathan Osser
Bought by
Rogers Jon M and Rogers Joanna E
Home Financials for this Owner
Home Financials are based on the most recent Mortgage that was taken out on this home.
Original Mortgage
$279,200
Interest Rate
7.62%
Create a Home Valuation Report for This Property
The Home Valuation Report is an in-depth analysis detailing your home's value as well as a comparison with similar homes in the area
Home Values in the Area
Average Home Value in this Area
Purchase History
| Date | Buyer | Sale Price | Title Company |
|---|---|---|---|
| Rodondi 2021 Trust | -- | Miller Cameron | |
| Rodondi James Joseph Jude | $560,000 | American Title Co | |
| Rogers Jon M | $349,000 | Fidelity National Title Co |
Source: Public Records
Mortgage History
| Date | Status | Borrower | Loan Amount |
|---|---|---|---|
| Previous Owner | Rodondi James Joseph Jude | $260,000 | |
| Previous Owner | Rogers Jon M | $279,200 | |
| Closed | Rogers Jon M | $34,900 |
Source: Public Records
Tax History Compared to Growth
Tax History
| Year | Tax Paid | Tax Assessment Tax Assessment Total Assessment is a certain percentage of the fair market value that is determined by local assessors to be the total taxable value of land and additions on the property. | Land | Improvement |
|---|---|---|---|---|
| 2025 | $10,345 | $843,816 | $421,908 | $421,908 |
| 2023 | $10,345 | $811,052 | $405,526 | $405,526 |
| 2022 | $9,680 | $795,150 | $397,575 | $397,575 |
| 2021 | $8,524 | $779,560 | $389,780 | $389,780 |
| 2020 | $8,409 | $771,568 | $385,784 | $385,784 |
| 2019 | $8,377 | $756,440 | $378,220 | $378,220 |
| 2018 | $8,158 | $741,608 | $370,804 | $370,804 |
| 2017 | $8,068 | $727,068 | $363,534 | $363,534 |
| 2016 | $7,927 | $712,812 | $356,406 | $356,406 |
| 2015 | $7,631 | $702,106 | $351,053 | $351,053 |
| 2014 | $7,484 | $688,354 | $344,177 | $344,177 |
Source: Public Records
Map
Nearby Homes
- 1159 Chesterton Ave
- 2504 Hastings Ave
- 1103 Connecticut Dr
- 3622 Farm Hill Blvd
- 3694 Country Club Dr
- 3647 Jefferson Ave
- 3654 Altamont Way
- 1830 Vera Ave
- 697 Glennan Dr
- 949 Pleasant Hill Rd
- 624 Sapphire St
- 3676 Mcnulty Way
- 542 Topaz St
- 2423 Palm Ave
- 2474 Washington Ave
- 1105 Valota Rd
- 1035 Valota Rd
- 991 Valota Rd
- 2013 Oregon Ave
- 795 Canyon Rd
- 1014 Alameda de Las Pulgas
- 1042 Alameda de Las Pulgas
- 1077 Chesterton Ave
- 1065 Chesterton Ave
- 2761 Mcgarvey Ave
- 2797 Mcgarvey Ave
- 1057 Chesterton Ave
- 1027 Alameda de Las Pulgas
- 2803 Mcgarvey Ave
- 1013 Alameda de Las Pulgas
- 1103 Chesterton Ave
- 1082 Chesterton Ave
- 2679 Mcgarvey Ave
- 1092 Chesterton Ave
- 1072 Chesterton Ave
- 1047 Chesterton Ave
- 2833 Mcgarvey Ave
- 1062 Chesterton Ave
- 1117 Chesterton Ave
- 998 Alameda de Las Pulgas