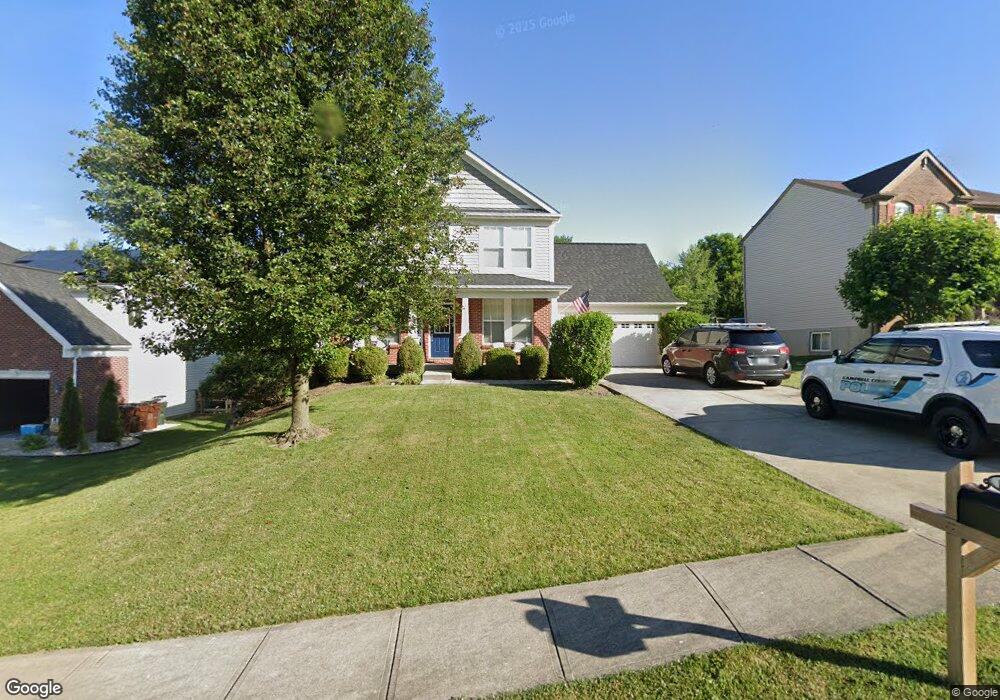
10291 Meadow Glen Dr Independence, KY 41051
Estimated Value: $389,000 - $429,000
3
Beds
4
Baths
2,378
Sq Ft
$168/Sq Ft
Est. Value
About This Home
This home is located at 10291 Meadow Glen Dr, Independence, KY 41051 and is currently estimated at $400,343, approximately $168 per square foot. 10291 Meadow Glen Dr is a home located in Kenton County with nearby schools including Simon Kenton High School, St. Cecilia Catholic School, and Zion Christian Academy.
Ownership History
Date
Name
Owned For
Owner Type
Purchase Details
Closed on
May 31, 2019
Sold by
Baker John B and Baker Johnica
Bought by
Lauer Christopher J
Current Estimated Value
Home Financials for this Owner
Home Financials are based on the most recent Mortgage that was taken out on this home.
Original Mortgage
$278,000
Outstanding Balance
$244,430
Interest Rate
4.1%
Mortgage Type
VA
Estimated Equity
$155,913
Purchase Details
Closed on
Nov 17, 2005
Sold by
Fischer Single Family Homes Ii Llc
Bought by
Baker John B and Baker Johnica
Home Financials for this Owner
Home Financials are based on the most recent Mortgage that was taken out on this home.
Original Mortgage
$229,150
Interest Rate
6.1%
Mortgage Type
Fannie Mae Freddie Mac
Purchase Details
Closed on
Jun 22, 2005
Sold by
Hasekoester Reese Llc
Bought by
Fischer Single Family Homes Ii Llc
Create a Home Valuation Report for This Property
The Home Valuation Report is an in-depth analysis detailing your home's value as well as a comparison with similar homes in the area
Home Values in the Area
Average Home Value in this Area
Purchase History
| Date | Buyer | Sale Price | Title Company |
|---|---|---|---|
| Lauer Christopher J | $278,000 | Prominent Title Agency Llc | |
| Baker John B | $241,215 | -- | |
| Fischer Single Family Homes Ii Llc | $37,650 | -- |
Source: Public Records
Mortgage History
| Date | Status | Borrower | Loan Amount |
|---|---|---|---|
| Open | Lauer Christopher J | $278,000 | |
| Previous Owner | Baker John B | $229,150 |
Source: Public Records
Tax History Compared to Growth
Tax History
| Year | Tax Paid | Tax Assessment Tax Assessment Total Assessment is a certain percentage of the fair market value that is determined by local assessors to be the total taxable value of land and additions on the property. | Land | Improvement |
|---|---|---|---|---|
| 2024 | $3,406 | $278,000 | $48,000 | $230,000 |
| 2023 | $3,508 | $278,000 | $48,000 | $230,000 |
| 2022 | $3,562 | $278,000 | $48,000 | $230,000 |
| 2021 | $3,615 | $278,000 | $48,000 | $230,000 |
| 2020 | $3,692 | $278,000 | $40,000 | $238,000 |
| 2019 | $3,222 | $241,200 | $40,000 | $201,200 |
| 2018 | $3,239 | $241,200 | $40,000 | $201,200 |
| 2017 | $3,150 | $241,200 | $40,000 | $201,200 |
| 2015 | $3,064 | $241,200 | $37,600 | $203,600 |
| 2014 | $3,020 | $241,200 | $37,600 | $203,600 |
Source: Public Records
Map
Nearby Homes
- Cumberland Plan at Meadow Glen - Maple Street Collection
- Wesley Plan at Meadow Glen - Maple Street Collection
- 1373 Meadowrun Ln
- 1355 Meadowcrest Cir
- 1375 Grandarbor Cir
- 1381 Poplartree Place
- 10150 Meadow Glen Dr
- 9972 Meadow Glen Dr
- 9947 Meadow Glen Dr
- 10363 Canberra Dr
- 10323 Manassas Ct
- 10438 Canberra Dr
- 1365 Cairns Ct
- 10448 Canberra Dr
- 10383 Lynchburg Dr
- 10311 Emancipation Place
- 114 Sylvan Dr
- 10434 Sharpsburg Dr
- 9831 Codyview Dr
- 1884 Bridle Path
- 10287 Meadow Glen Dr
- 10295 Meadow Glen Dr
- 10295 Meadow Glen Dr Unit 8
- 10283 Meadow Glen Dr
- 10283 Meadow Glen Dr Unit 11
- 10299 Meadow Glen Dr
- 10299 Meadow Glen Dr Unit 7
- 10286 Meadow Glen Dr
- 10290 Meadow Glen Dr
- 10282 Meadow Glen Dr
- 10282 Highmeadow Ln
- 10303 Meadow Glen Dr
- 10294 Meadow Glen Dr
- 10294 Meadow Glen Dr Unit 49
- 10278 Meadow Glen Dr
- 10298 Meadow Glen Dr
- 10275 Meadow Glen Dr
- 10275 Meadow Glen Dr Unit 13
- 10307 Meadow Glen Dr
- 10274 Meadow Glen Dr