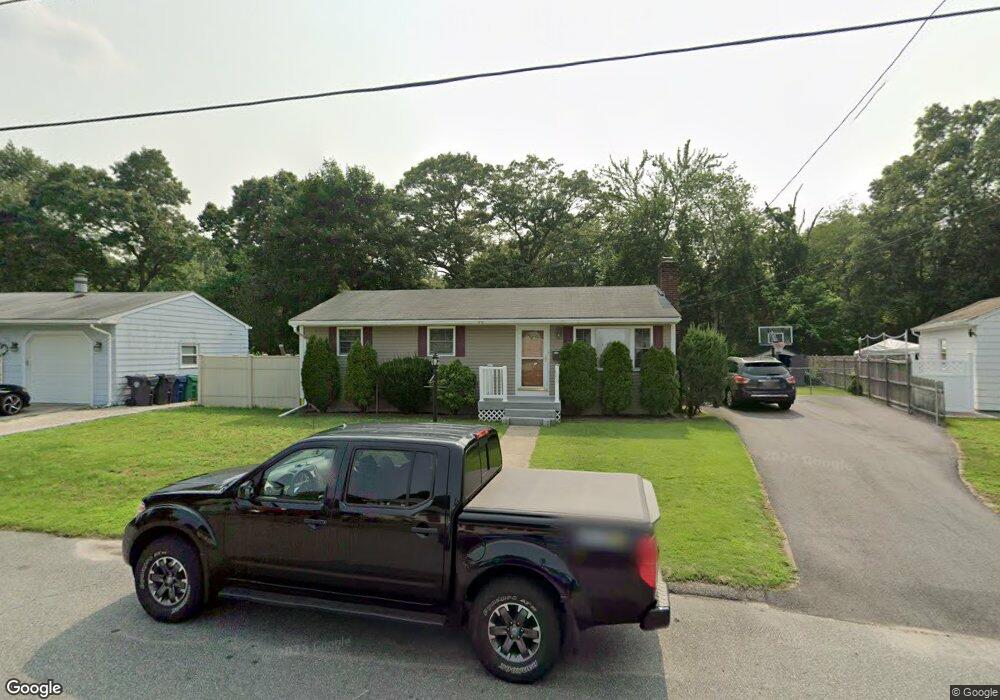
103 Burbank Dr Warwick, RI 02886
Hillsgrove NeighborhoodEstimated Value: $377,000 - $414,000
3
Beds
2
Baths
1,560
Sq Ft
$258/Sq Ft
Est. Value
About This Home
This home is located at 103 Burbank Dr, Warwick, RI 02886 and is currently estimated at $402,359, approximately $257 per square foot. 103 Burbank Dr is a home located in Kent County with nearby schools including St Rose Of Lima School.
Ownership History
Date
Name
Owned For
Owner Type
Purchase Details
Closed on
Feb 28, 2008
Sold by
Earle Robert F and Earle Angela M
Bought by
Oka Leilani A and Olea Elias P
Current Estimated Value
Home Financials for this Owner
Home Financials are based on the most recent Mortgage that was taken out on this home.
Original Mortgage
$225,900
Interest Rate
5.8%
Mortgage Type
Purchase Money Mortgage
Purchase Details
Closed on
Jan 8, 2003
Sold by
Nolan Matthew and Nolan Renee J
Bought by
Earle Robert F and Earle Angela M
Purchase Details
Closed on
May 21, 1999
Sold by
Collins Shirley E
Bought by
Nolan Matthew
Create a Home Valuation Report for This Property
The Home Valuation Report is an in-depth analysis detailing your home's value as well as a comparison with similar homes in the area
Home Values in the Area
Average Home Value in this Area
Purchase History
| Date | Buyer | Sale Price | Title Company |
|---|---|---|---|
| Oka Leilani A | $225,900 | -- | |
| Earle Robert F | $156,000 | -- | |
| Nolan Matthew | $83,500 | -- |
Source: Public Records
Mortgage History
| Date | Status | Borrower | Loan Amount |
|---|---|---|---|
| Open | Nolan Matthew | $225,900 | |
| Closed | Nolan Matthew | $215,400 | |
| Closed | Nolan Matthew | $225,900 |
Source: Public Records
Tax History Compared to Growth
Tax History
| Year | Tax Paid | Tax Assessment Tax Assessment Total Assessment is a certain percentage of the fair market value that is determined by local assessors to be the total taxable value of land and additions on the property. | Land | Improvement |
|---|---|---|---|---|
| 2025 | $4,323 | $340,400 | $103,800 | $236,600 |
| 2024 | $4,124 | $285,000 | $85,700 | $199,300 |
| 2023 | $4,044 | $285,000 | $85,700 | $199,300 |
| 2022 | $3,810 | $203,400 | $55,900 | $147,500 |
| 2021 | $3,810 | $203,400 | $55,900 | $147,500 |
| 2020 | $3,810 | $203,400 | $55,900 | $147,500 |
| 2019 | $3,810 | $203,400 | $55,900 | $147,500 |
| 2018 | $3,068 | $147,500 | $47,200 | $100,300 |
| 2017 | $2,985 | $147,500 | $47,200 | $100,300 |
| 2016 | $2,985 | $147,500 | $47,200 | $100,300 |
| 2015 | $3,104 | $149,600 | $58,100 | $91,500 |
| 2014 | $3,001 | $149,600 | $58,100 | $91,500 |
| 2013 | $2,961 | $149,600 | $58,100 | $91,500 |
Source: Public Records
Map
Nearby Homes
- 185 Brentwood Ave
- 38 Parade Rd
- 38 Red Maple Ln
- 28 Liverpool St
- 137 Dickens St
- 3 Grant St
- 62 Red Maple Ln
- 64 Ormsby Ave
- 79 Carpenter St
- 53 Uphill Ave
- 121 Hamilton Ave
- 70 Turner St Unit C-6
- 74 Stephens Ave
- 16 Arrow Ave
- 71 Macarthur Dr
- 95 Kerri Lyn Rd
- 62 Stone Ave
- 85 Union Ave
- 106 Palace Ave
- 288 Cove Ave