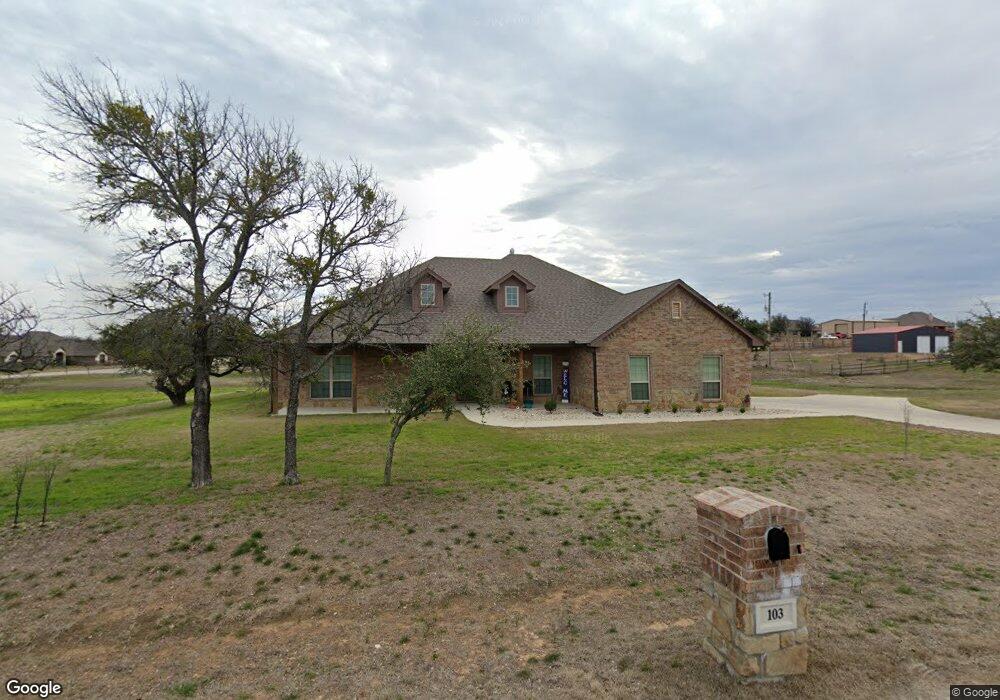
103 Churchill Cir Weatherford, TX 76085
Estimated Value: $461,000 - $489,000
4
Beds
2
Baths
2,044
Sq Ft
$230/Sq Ft
Est. Value
About This Home
This home is located at 103 Churchill Cir, Weatherford, TX 76085 and is currently estimated at $470,159, approximately $230 per square foot. 103 Churchill Cir is a home located in Parker County with nearby schools including Silver Creek Elementary School, Azle Elementary School, and Azle Junior High School.
Ownership History
Date
Name
Owned For
Owner Type
Purchase Details
Closed on
Jun 30, 2021
Sold by
The Gabriela Delacruz & Wells Company
Bought by
Wright Donnie
Current Estimated Value
Purchase Details
Closed on
Jun 29, 2021
Sold by
Gabriela Delacruz & Wells Co
Bought by
Wright Donnie
Purchase Details
Closed on
Apr 26, 2016
Sold by
Burton Carl R
Bought by
Mcdonald Erin and Mcdonald Jason
Home Financials for this Owner
Home Financials are based on the most recent Mortgage that was taken out on this home.
Original Mortgage
$206,910
Interest Rate
3.73%
Mortgage Type
New Conventional
Purchase Details
Closed on
Nov 19, 2015
Sold by
C R Burton Custom Homes Llc
Bought by
Mcdonald Erin and Mcdonald Jason
Purchase Details
Closed on
Oct 12, 2015
Sold by
Partagas Properties Ltd
Bought by
Mcdonald Erin and Mcdonald Jason
Purchase Details
Closed on
Aug 29, 2002
Bought by
Mcdonald Erin and Mcdonald Jason
Create a Home Valuation Report for This Property
The Home Valuation Report is an in-depth analysis detailing your home's value as well as a comparison with similar homes in the area
Home Values in the Area
Average Home Value in this Area
Purchase History
| Date | Buyer | Sale Price | Title Company |
|---|---|---|---|
| Wright Donnie | -- | Providence Title Company | |
| Wright Donnie | -- | Providence Title Company | |
| Mcdonald Erin | -- | Attorney | |
| Mcdonald Erin | -- | -- | |
| Mcdonald Erin | -- | -- | |
| Mcdonald Erin | -- | -- |
Source: Public Records
Mortgage History
| Date | Status | Borrower | Loan Amount |
|---|---|---|---|
| Previous Owner | Mcdonald Erin | $206,910 |
Source: Public Records
Tax History Compared to Growth
Tax History
| Year | Tax Paid | Tax Assessment Tax Assessment Total Assessment is a certain percentage of the fair market value that is determined by local assessors to be the total taxable value of land and additions on the property. | Land | Improvement |
|---|---|---|---|---|
| 2025 | $2,738 | $501,300 | $106,450 | $394,850 |
| 2024 | $2,738 | $460,250 | $92,230 | $368,020 |
| 2023 | $2,738 | $460,250 | $92,230 | $368,020 |
| 2022 | $5,925 | $320,200 | $44,360 | $275,840 |
| 2021 | $6,208 | $320,200 | $44,360 | $275,840 |
| 2020 | $5,354 | $277,670 | $35,380 | $242,290 |
| 2019 | $5,675 | $277,670 | $35,380 | $242,290 |
| 2018 | $4,726 | $230,510 | $30,000 | $200,510 |
| 2017 | $4,503 | $230,510 | $30,000 | $200,510 |
| 2016 | $1,306 | $66,840 | $30,000 | $36,840 |
| 2015 | $87 | $12,000 | $12,000 | $0 |
| 2014 | $234 | $12,000 | $12,000 | $0 |
Source: Public Records
Map
Nearby Homes
- 181 Churchill Cir
- 4024 Olivia Lucille St
- 209 Churchill Ct
- 133 Miramar Cir
- 1020 Boulder Rd
- 1017 Don Eve Ct
- 1009 Boulder Rd
- 1016 Don Eve Ct
- 1032 Don Eve Ct
- 1028 Don Eve Ct
- 1024 Don Eve Ct
- 1025 Don Eve Ct
- 1013 Don Eve Ct
- 1005 Don Eve Ct
- 1012 Don Eve Ct
- 6021 Piper Anne St
- 1004 Don Eve Ct
- 5017 Freestone Dr
- 1008 Don Eve Ct
- Lot 143 Blk 4 Veal Station Rd
- 118 Partagas Dr
- 104 Churchill Cir
- 107 Churchill Cir
- 100 Churchill Cir
- 108 Churchill Cir
- 115 Partagas Dr
- 119 Partagas Dr
- 122 Partagas Dr
- 111 Churchill Cir
- 175 Churchill Cir
- 112 Churchill Cir
- Lot 22 Churchill Cir
- Lot 37 Churchill Cir
- Lot 61 Churchill Cir
- 100 Miramar Cir
- 115 Churchill Cir
- 108 Montecristo Dr
- 161 Churchill Cir
- 112 Montecristo Dr
- 104 Montecristo Dr