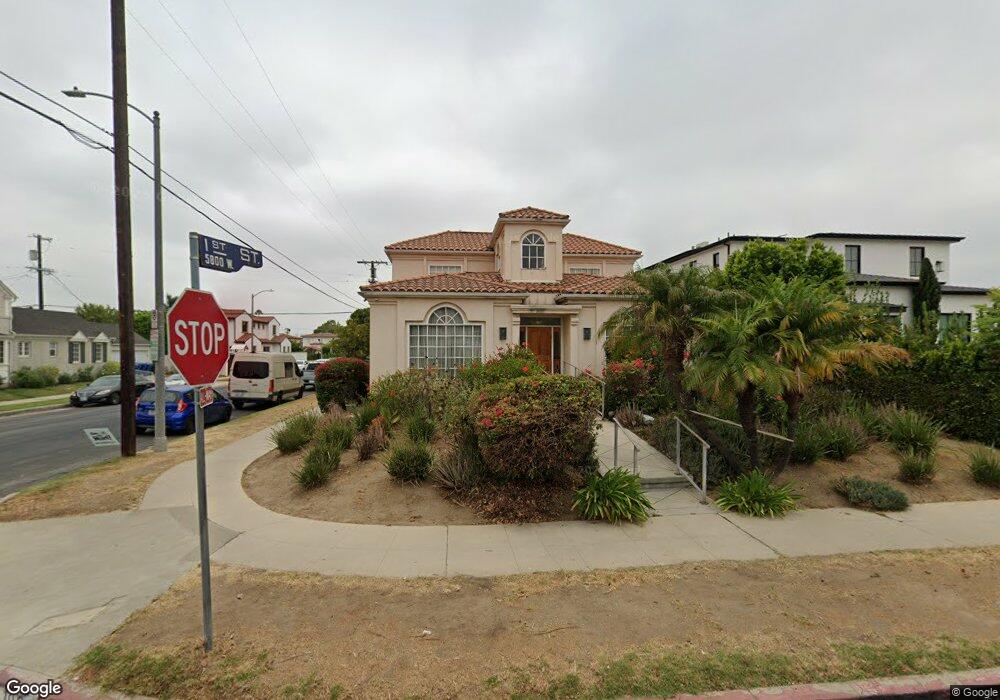
103 N Formosa Ave Los Angeles, CA 90036
Melrose NeighborhoodEstimated Value: $2,392,000 - $3,503,000
4
Beds
5
Baths
4,648
Sq Ft
$656/Sq Ft
Est. Value
About This Home
This home is located at 103 N Formosa Ave, Los Angeles, CA 90036 and is currently estimated at $3,048,805, approximately $655 per square foot. 103 N Formosa Ave is a home located in Los Angeles County with nearby schools including Third Street Elementary School, John Burroughs Middle School, and Fairfax High School.
Ownership History
Date
Name
Owned For
Owner Type
Purchase Details
Closed on
May 19, 2023
Sold by
Schulman Jacob Meyer
Bought by
Schulman Family Trust and Schulman
Current Estimated Value
Purchase Details
Closed on
May 16, 2023
Sold by
Schulman Marcus Isaac
Bought by
Schulman
Purchase Details
Closed on
Nov 10, 1994
Sold by
Schulman Morton Louis and Schulman Miriam Rose
Bought by
Schulman Morton Louis and Schulman Miriam Rose
Purchase Details
Closed on
Aug 27, 1993
Sold by
Schulman Morton Louis and Schulman Miriam Rose
Bought by
Schulman Morton Louis and Schulman Miriam Rose
Home Financials for this Owner
Home Financials are based on the most recent Mortgage that was taken out on this home.
Original Mortgage
$250,000
Interest Rate
7.28%
Create a Home Valuation Report for This Property
The Home Valuation Report is an in-depth analysis detailing your home's value as well as a comparison with similar homes in the area
Home Values in the Area
Average Home Value in this Area
Purchase History
| Date | Buyer | Sale Price | Title Company |
|---|---|---|---|
| Schulman Family Trust | -- | None Listed On Document | |
| Schulman | -- | None Listed On Document | |
| Schulman Jacob | -- | None Listed On Document | |
| Schulman Morton Louis | -- | -- | |
| Schulman Morton Louis | -- | Southern California Title Co |
Source: Public Records
Mortgage History
| Date | Status | Borrower | Loan Amount |
|---|---|---|---|
| Previous Owner | Schulman Morton Louis | $250,000 |
Source: Public Records
Tax History Compared to Growth
Tax History
| Year | Tax Paid | Tax Assessment Tax Assessment Total Assessment is a certain percentage of the fair market value that is determined by local assessors to be the total taxable value of land and additions on the property. | Land | Improvement |
|---|---|---|---|---|
| 2025 | $35,397 | $2,954,736 | $2,496,960 | $457,776 |
| 2024 | $35,397 | $2,899,860 | $2,448,000 | $451,860 |
| 2023 | $7,669 | $595,424 | $128,102 | $467,322 |
| 2022 | $7,329 | $583,750 | $125,591 | $458,159 |
| 2021 | $7,212 | $572,305 | $123,129 | $449,176 |
| 2019 | $7,003 | $555,332 | $119,478 | $435,854 |
| 2018 | $6,861 | $544,444 | $117,136 | $427,308 |
| 2016 | $6,517 | $523,305 | $112,589 | $410,716 |
| 2015 | $6,424 | $515,445 | $110,898 | $404,547 |
| 2014 | $6,450 | $505,349 | $108,726 | $396,623 |
Source: Public Records
Map
Nearby Homes
- 147 N Detroit St
- 160 S Poinsettia Place
- 183 S Detroit St
- 109 N Sycamore Ave Unit 102
- 203 S Detroit St Unit 201
- 143 N Sycamore Ave
- 101 S Fuller Ave
- 120 N Orange Dr
- 315 N Martel Ave
- 107 S Gardner St
- 344 N Vista St
- 191 S Gardner St
- 143 S Highland Ave
- 420 N Orange Dr
- 358 S Sycamore Ave
- 530 N Alta Vista Blvd
- 348 S Orange Dr
- 434 N Mansfield Ave
- 525 N Sycamore Ave Unit 326
- 525 N Sycamore Ave Unit 301
- 109 N Formosa Ave
- 111 N Formosa Ave
- 101 S Formosa Ave
- 117 N Formosa Ave
- 102 N Alta Vista Blvd
- 108 N Alta Vista Blvd
- 109 S Formosa Ave
- 112 N Alta Vista Blvd
- 100 S Alta Vista Blvd
- 123 N Formosa Ave
- 102 N Formosa Ave
- 108 N Formosa Ave
- 118 N Alta Vista Blvd
- 115 S Formosa Ave
- 112 N Formosa Ave
- 108 S Alta Vista Blvd
- 104 S Formosa Ave
- 127 N Formosa Ave
- 122 N Alta Vista Blvd
- 118 N Formosa Ave