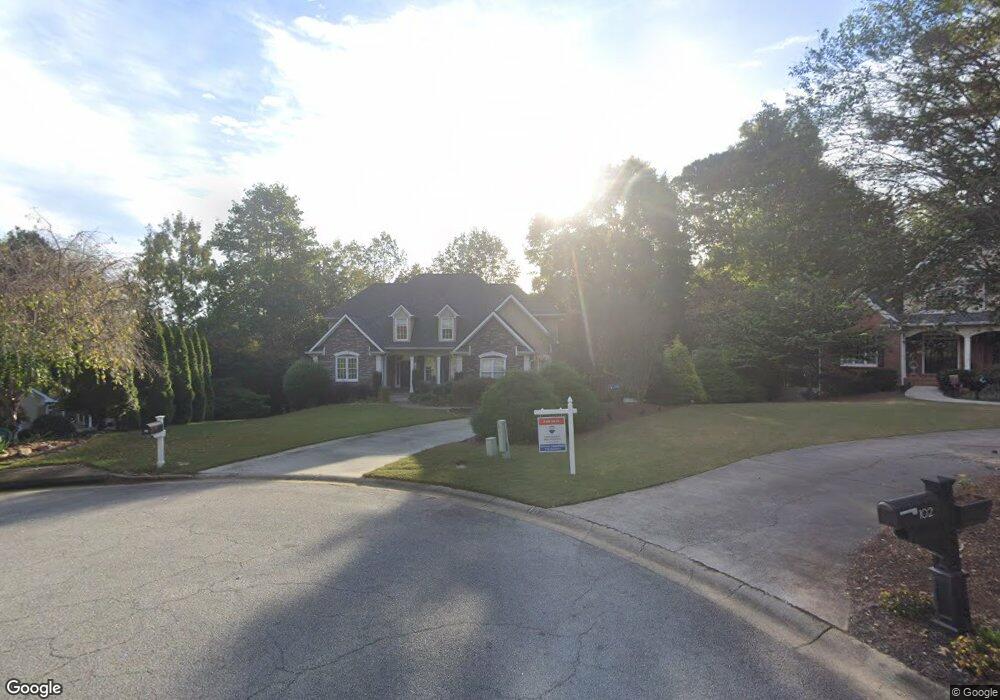
103 Passage Point Peachtree City, GA 30269
Estimated Value: $1,021,000 - $1,119,000
6
Beds
5
Baths
5,708
Sq Ft
$188/Sq Ft
Est. Value
About This Home
This home is located at 103 Passage Point, Peachtree City, GA 30269 and is currently estimated at $1,074,159, approximately $188 per square foot. 103 Passage Point is a home located in Fayette County with nearby schools including Kedron Elementary School, Booth Middle School, and McIntosh High School.
Ownership History
Date
Name
Owned For
Owner Type
Purchase Details
Closed on
Jan 20, 2021
Sold by
Nirenberg Dan and Nirenberg Mary
Bought by
The-Q-Investment-Group Llc
Current Estimated Value
Home Financials for this Owner
Home Financials are based on the most recent Mortgage that was taken out on this home.
Original Mortgage
$525,200
Outstanding Balance
$467,832
Interest Rate
2.6%
Mortgage Type
Commercial
Estimated Equity
$606,327
Purchase Details
Closed on
Jun 30, 2016
Sold by
Hickson Seabie W and Hickson Karen M
Bought by
Nirenberg Dan and Manthey Mary
Home Financials for this Owner
Home Financials are based on the most recent Mortgage that was taken out on this home.
Original Mortgage
$520,000
Interest Rate
3.66%
Purchase Details
Closed on
Aug 30, 1995
Sold by
Pea City Hldgs
Bought by
Simms Homes
Create a Home Valuation Report for This Property
The Home Valuation Report is an in-depth analysis detailing your home's value as well as a comparison with similar homes in the area
Home Values in the Area
Average Home Value in this Area
Purchase History
| Date | Buyer | Sale Price | Title Company |
|---|---|---|---|
| The-Q-Investment-Group Llc | $808,000 | None Listed On Document | |
| The Q Investment Grp Llc | $808,000 | -- | |
| Nirenberg Dan | $650,000 | -- | |
| Simms Homes | $75,000 | -- |
Source: Public Records
Mortgage History
| Date | Status | Borrower | Loan Amount |
|---|---|---|---|
| Open | The Q Investment Grp Llc | $525,200 | |
| Previous Owner | Nirenberg Dan | $520,000 |
Source: Public Records
Tax History Compared to Growth
Tax History
| Year | Tax Paid | Tax Assessment Tax Assessment Total Assessment is a certain percentage of the fair market value that is determined by local assessors to be the total taxable value of land and additions on the property. | Land | Improvement |
|---|---|---|---|---|
| 2024 | $11,862 | $401,344 | $42,000 | $359,344 |
| 2023 | $10,719 | $353,320 | $42,000 | $311,320 |
| 2022 | $9,789 | $323,200 | $38,640 | $284,560 |
| 2021 | $8,646 | $298,900 | $47,500 | $251,400 |
| 2020 | $9,456 | $306,500 | $47,500 | $259,000 |
| 2019 | $9,574 | $307,300 | $47,500 | $259,800 |
| 2018 | $9,114 | $288,020 | $47,500 | $240,520 |
| 2017 | $8,339 | $260,000 | $45,320 | $214,680 |
| 2016 | $8,358 | $253,020 | $47,500 | $205,520 |
| 2015 | $7,653 | $228,060 | $47,500 | $180,560 |
| 2014 | $7,375 | $216,100 | $47,500 | $168,600 |
| 2013 | -- | $211,740 | $0 | $0 |
Source: Public Records
Map
Nearby Homes
- 833 Southern Shore Dr
- 109 Peninsula Dr
- 107 Rolling Green
- 606 Wingspread
- 718 Avalon Way
- 522 Golf View Dr
- 522 Golfview Dr
- 200 Doe Run
- 504 Telfair Park
- 311 Longer Dr
- 115 Stonington Dr
- 132 Sea Island Dr
- 301 Abercorn Square
- 300 Abercorn Square
- 101 Parkway Dr
- 134 Mellington Ln
- 100 Smokerise Trace
- 112 Bridgewater Dr
- 115 Cottage Grove
- 221 N Cove Dr
- 0 Passage Point Unit 8896560
- 0 Passage Point Unit 7640348
- 0 Passage Point
- 101 Passage Point
- 100 Passage Point
- 705 Four Winds Pointe
- 810 Southern Shore Dr
- 808 Southern Shore Dr
- 204 Palisades
- 706 4 Winds Pointe
- 706 Four Winds Pointe
- 806 Southern Shore Dr
- 200 Palisades
- 0 the Palisades Unit 7178842
- 0 the Palisades Unit 8734710
- 0 the Palisades Unit 8935719
- 0 the Palisades Unit 3254680
- 0 the Palisades Unit 7156423
- 0 the Palisades
- 703 Four Winds Pointe