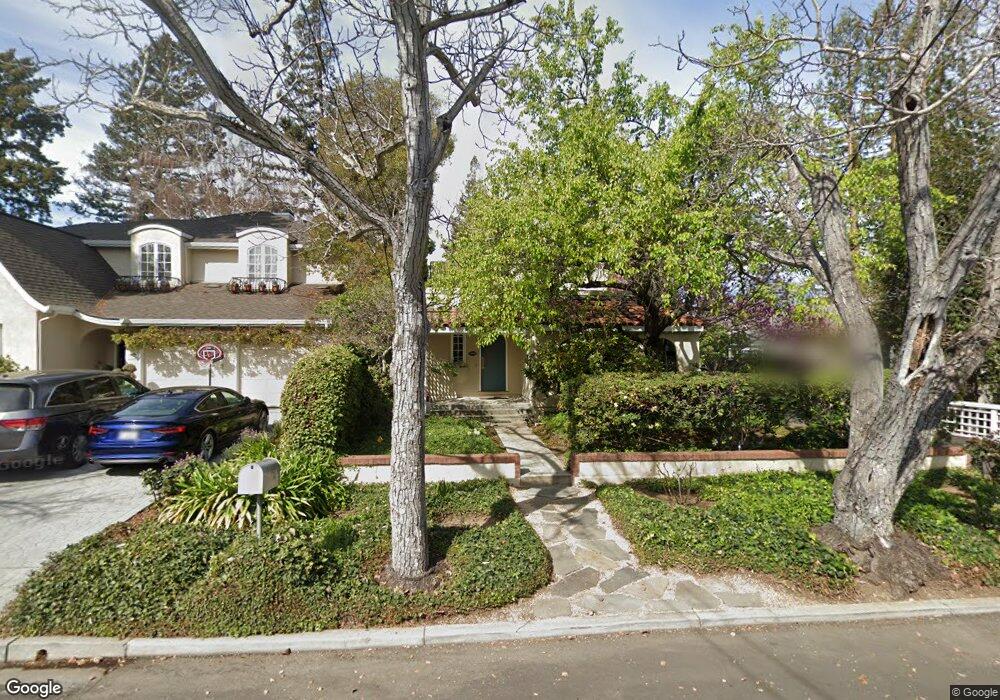
1030 College Ave Menlo Park, CA 94025
Downtown Menlo Park NeighborhoodEstimated Value: $4,128,000 - $4,968,000
3
Beds
3
Baths
2,600
Sq Ft
$1,702/Sq Ft
Est. Value
About This Home
This home is located at 1030 College Ave, Menlo Park, CA 94025 and is currently estimated at $4,425,795, approximately $1,702 per square foot. 1030 College Ave is a home located in San Mateo County with nearby schools including Oak Knoll Elementary School, Hillview Middle School, and Menlo-Atherton High School.
Ownership History
Date
Name
Owned For
Owner Type
Purchase Details
Closed on
Feb 13, 2024
Sold by
Vansickle Curtis Keith and Vansickle Valerie L
Bought by
Vansickle Curtis Keith and Vansickle Van Sickle
Current Estimated Value
Purchase Details
Closed on
Jun 14, 2013
Sold by
Vansickle Curtis Keith and Van Sickle Valerie L
Bought by
Vansickle Curtis Keith and Van Sickle Valerie L
Home Financials for this Owner
Home Financials are based on the most recent Mortgage that was taken out on this home.
Original Mortgage
$320,000
Interest Rate
3.38%
Mortgage Type
New Conventional
Purchase Details
Closed on
Mar 17, 1994
Sold by
Gadsby Leslie
Bought by
Vansickle C Keith and Vansickle Valerie L
Home Financials for this Owner
Home Financials are based on the most recent Mortgage that was taken out on this home.
Original Mortgage
$588,000
Interest Rate
7.15%
Create a Home Valuation Report for This Property
The Home Valuation Report is an in-depth analysis detailing your home's value as well as a comparison with similar homes in the area
Home Values in the Area
Average Home Value in this Area
Purchase History
| Date | Buyer | Sale Price | Title Company |
|---|---|---|---|
| Vansickle Curtis Keith | -- | None Listed On Document | |
| Vansickle Curtis Keith | -- | Cornerstone Title Company | |
| Vansickle C Keith | $735,000 | North American Title Co Inc |
Source: Public Records
Mortgage History
| Date | Status | Borrower | Loan Amount |
|---|---|---|---|
| Previous Owner | Vansickle Curtis Keith | $320,000 | |
| Previous Owner | Vansickle C Keith | $588,000 |
Source: Public Records
Tax History Compared to Growth
Tax History
| Year | Tax Paid | Tax Assessment Tax Assessment Total Assessment is a certain percentage of the fair market value that is determined by local assessors to be the total taxable value of land and additions on the property. | Land | Improvement |
|---|---|---|---|---|
| 2025 | $14,798 | $1,249,252 | $624,626 | $624,626 |
| 2023 | $14,798 | $1,200,744 | $600,372 | $600,372 |
| 2022 | $15,623 | $1,177,200 | $588,600 | $588,600 |
| 2021 | $15,189 | $1,154,118 | $577,059 | $577,059 |
| 2020 | $15,070 | $1,142,284 | $571,142 | $571,142 |
| 2019 | $14,849 | $1,119,888 | $559,944 | $559,944 |
| 2018 | $14,458 | $1,097,930 | $548,965 | $548,965 |
| 2017 | $14,206 | $1,076,402 | $538,201 | $538,201 |
| 2016 | $13,738 | $1,055,298 | $527,649 | $527,649 |
| 2015 | $13,576 | $1,039,448 | $519,724 | $519,724 |
| 2014 | $13,311 | $1,019,088 | $509,544 | $509,544 |
Source: Public Records
Map
Nearby Homes
- 308 Yale Rd
- 841 Partridge Ave
- 455 San Mateo Dr
- 905 Fremont Place
- 5 Artisan Way
- 115 El Camino Real Unit 202
- 115 El Camino Real Unit 203
- 660 Roble Ave
- 461 Burgess Dr Unit 4
- 1278 Santa Cruz Ave
- 460 Olive St
- 1357 Johnson St
- 1100 Hobart St
- 101 Alma St Unit 1102
- 101 Alma St Unit 207
- 1330 University Dr Unit 66
- 1300 Hoover St
- 1001 Olive St
- 235 Alma St
- 1326 Hoover St Unit 6
- 1024 College Ave
- 1034 College Ave
- 1012 College Ave
- 1036 College Ave
- 1050 College Ave
- 401 Yale Rd
- 1025 Middle Ave
- 1019 Middle Ave
- 1035 Middle Ave
- 1009 Middle Ave
- 1045 College Ave
- 445 Yale Rd
- 1060 College Ave
- 1025 College Ave
- 1021 College Ave
- 1045 Middle Ave
- 375 Yale Rd
- 340 Princeton Rd
- 455 Yale Rd
- 1068 College Ave