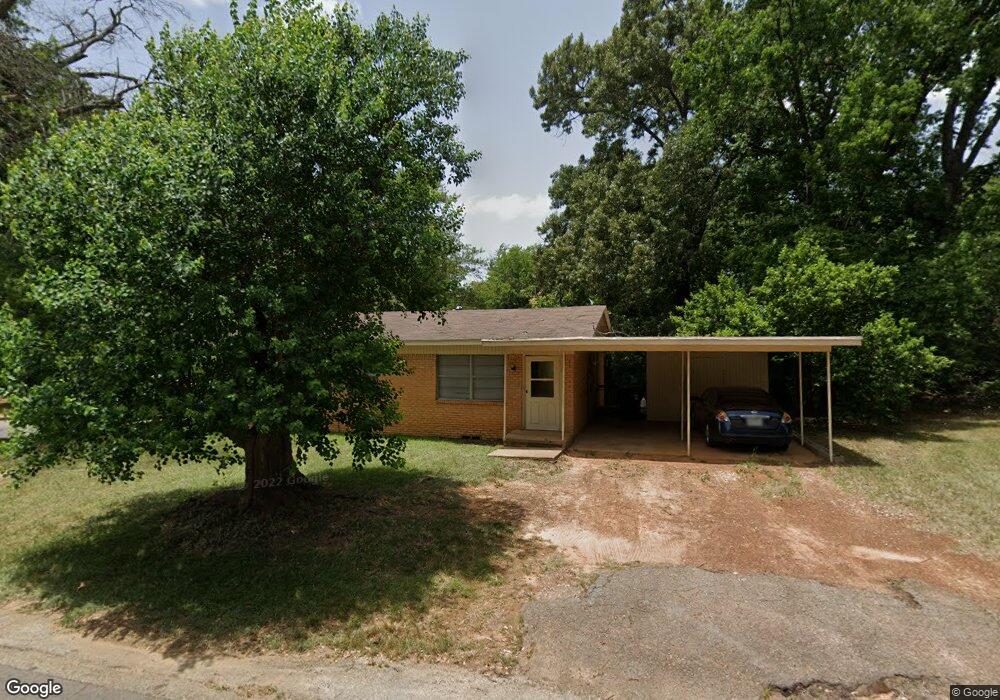
1031 Magnolia Dr Tyler, TX 75701
Midtown Tyler NeighborhoodEstimated Value: $179,000 - $189,519
--
Bed
2
Baths
1,209
Sq Ft
$151/Sq Ft
Est. Value
About This Home
This home is located at 1031 Magnolia Dr, Tyler, TX 75701 and is currently estimated at $183,130, approximately $151 per square foot. 1031 Magnolia Dr is a home located in Smith County with nearby schools including Bell Elementary School, Moore Middle School, and Tyler High School.
Ownership History
Date
Name
Owned For
Owner Type
Purchase Details
Closed on
Jun 19, 2012
Sold by
Cotton Md James R
Bought by
Oti Md Ifeatu
Current Estimated Value
Purchase Details
Closed on
Aug 1, 2010
Sold by
Pamatmat Md Stephen D and Martin Diaz Md Stefanie
Bought by
Ball Md Corey Don
Create a Home Valuation Report for This Property
The Home Valuation Report is an in-depth analysis detailing your home's value as well as a comparison with similar homes in the area
Home Values in the Area
Average Home Value in this Area
Purchase History
| Date | Buyer | Sale Price | Title Company |
|---|---|---|---|
| Oti Md Ifeatu | -- | None Available | |
| Ball Md Corey Don | -- | None Available |
Source: Public Records
Mortgage History
| Date | Status | Borrower | Loan Amount |
|---|---|---|---|
| Closed | Oti Md Ifeatu | $0 |
Source: Public Records
Tax History Compared to Growth
Tax History
| Year | Tax Paid | Tax Assessment Tax Assessment Total Assessment is a certain percentage of the fair market value that is determined by local assessors to be the total taxable value of land and additions on the property. | Land | Improvement |
|---|---|---|---|---|
| 2024 | $3,129 | $183,908 | $34,073 | $151,521 |
| 2023 | $2,672 | $153,257 | $34,073 | $119,184 |
| 2022 | $2,480 | $126,577 | $27,258 | $99,319 |
| 2021 | $1,899 | $90,517 | $27,258 | $63,259 |
| 2020 | $1,919 | $89,663 | $27,258 | $62,405 |
| 2019 | $2,038 | $73,798 | $27,258 | $46,540 |
| 2018 | $1,377 | $63,329 | $19,470 | $43,859 |
| 2017 | $1,352 | $63,329 | $19,470 | $43,859 |
| 2016 | $1,323 | $61,974 | $19,470 | $42,504 |
| 2015 | $1,255 | $60,182 | $19,470 | $40,712 |
| 2014 | $1,255 | $59,082 | $19,470 | $39,612 |
Source: Public Records
Map
Nearby Homes
- 1118 S Fleishel Ave
- 1226 S Fleishel Ave
- 1432 E Don St
- 1528 E Devine St
- 1314 E Dawson St
- 837 S Palmer Ave
- 912 S Palmer Ave
- 613 S Baxter Ave
- 520 E Lake St
- 1725 S Mahon Ave
- 1400 San Antonio St
- 1515 E 6th St
- 1730 S Mahon Ave
- 1910 E Lake St
- 1914 Parklen St
- 1300 Sunset Dr
- 1322 Sunset Dr
- 1422 Sunset Dr
- 517 E Wells St
- 1931 S Wiley Ave
- 1023 Magnolia Dr
- 1138 E Lake St
- 1017 Magnolia Dr
- 1136 E Lake St
- 1210 E Lake St
- 1136 1136 Lake E
- 1020 1020 Magnolia
- 1121 Elizabeth Dr
- 1020 Magnolia Dr
- 1009 Magnolia Dr
- 1016 Magnolia Dr
- 1120 Carol Ln
- 1120 1120 Carol
- 1232 E Lake St
- 10138 E Lake St
- 1025 S Baxter Ave
- 1001 Magnolia Dr
- 1019 S Baxter Ave
- 1008 Magnolia Dr
- 1200 Carol Ln