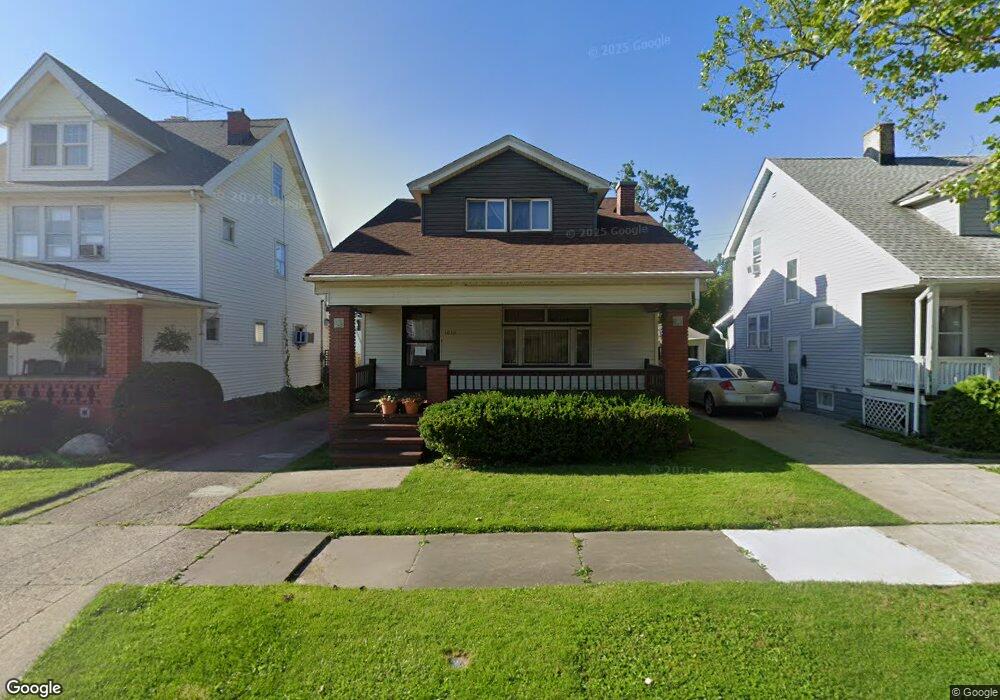
10311 Russell Ave Cleveland, OH 44125
Estimated Value: $64,000 - $79,589
2
Beds
1
Bath
1,458
Sq Ft
$51/Sq Ft
Est. Value
About This Home
This home is located at 10311 Russell Ave, Cleveland, OH 44125 and is currently estimated at $74,196, approximately $50 per square foot. 10311 Russell Ave is a home located in Cuyahoga County with nearby schools including Garfield Heights High School, North Shore High School, and Holy Name Elementary School.
Ownership History
Date
Name
Owned For
Owner Type
Purchase Details
Closed on
Aug 2, 2024
Sold by
Humphrey Francis J and Humphrey Ann M
Bought by
Willard Nathanael R and Willard Kay-Lee D
Current Estimated Value
Home Financials for this Owner
Home Financials are based on the most recent Mortgage that was taken out on this home.
Original Mortgage
$51,365
Outstanding Balance
$50,784
Interest Rate
6.87%
Mortgage Type
New Conventional
Estimated Equity
$23,412
Purchase Details
Closed on
Feb 25, 2022
Sold by
Sudvary and Jay
Bought by
Humphrey Francis J and Humphrey Ann M
Purchase Details
Closed on
Nov 22, 2021
Sold by
Estate Of William C Tyler
Bought by
Sudvary Theresa
Purchase Details
Closed on
Oct 22, 1976
Sold by
Thomas Eleanor
Bought by
Tyler William C
Purchase Details
Closed on
Jan 1, 1975
Bought by
Thomas Eleanor
Create a Home Valuation Report for This Property
The Home Valuation Report is an in-depth analysis detailing your home's value as well as a comparison with similar homes in the area
Home Values in the Area
Average Home Value in this Area
Purchase History
| Date | Buyer | Sale Price | Title Company |
|---|---|---|---|
| Willard Nathanael R | $56,350 | Stewart Title | |
| Humphrey Francis J | $52,500 | Erieview Title Agency | |
| Sudvary Theresa | -- | None Available | |
| Tyler William C | $32,000 | -- | |
| Thomas Eleanor | -- | -- |
Source: Public Records
Mortgage History
| Date | Status | Borrower | Loan Amount |
|---|---|---|---|
| Open | Willard Nathanael R | $51,365 |
Source: Public Records
Tax History Compared to Growth
Tax History
| Year | Tax Paid | Tax Assessment Tax Assessment Total Assessment is a certain percentage of the fair market value that is determined by local assessors to be the total taxable value of land and additions on the property. | Land | Improvement |
|---|---|---|---|---|
| 2024 | $2,124 | $19,740 | $7,000 | $12,740 |
| 2023 | $2,106 | $18,380 | $4,760 | $13,620 |
| 2022 | $2,790 | $25,340 | $4,760 | $20,580 |
| 2021 | $1,946 | $25,340 | $4,760 | $20,580 |
| 2020 | $1,478 | $20,270 | $3,820 | $16,450 |
| 2019 | $1,465 | $57,900 | $10,900 | $47,000 |
| 2018 | $757 | $20,270 | $3,820 | $16,450 |
| 2017 | $1,357 | $18,730 | $3,050 | $15,680 |
| 2016 | $1,376 | $18,730 | $3,050 | $15,680 |
| 2015 | $1,722 | $18,730 | $3,050 | $15,680 |
| 2014 | $1,722 | $22,820 | $3,710 | $19,110 |
Source: Public Records
Map
Nearby Homes
- 10307 Russell Ave
- 10403 Russell Ave
- 10105 Russell Ave
- 4846 Edgepark Dr
- 10209 Runnymede Ave
- 10201 Greenview Ave
- 10000 Greenview Ave
- 10105 Greenview Ave
- 4885 E 107th St
- 10217 Parkview Ave
- 4859 E 97th St
- 4953 E 106th St
- 4935 E 109th St
- 9722 Robinson Ave
- 4883 E 96th St
- 4864 E 96th St
- 9435 Dorothy Ave
- 10718 Vernon Ave
- 9507 Bohning Dr
- 11209 Langton Ave
- 10315 Russell Ave
- 10303 Russell Ave
- 10312 Edgepark Dr
- 10304 Edgepark Dr
- 10407 Russell Ave
- 10217 Russell Ave
- 10400 Edgepark Dr
- 10300 Edgepark Dr
- 10310 Russell Ave
- 10404 Edgepark Dr
- 10306 Russell Ave
- 10213 Russell Ave
- 10402 Russell Ave
- 10302 Russell Ave
- 10216 Edgepark Dr
- 4802 Edgepark Dr
- 10408 Edgepark Dr
- 10214 Russell Ave
- 4798 Edgepark Dr
- 10209 Russell Ave