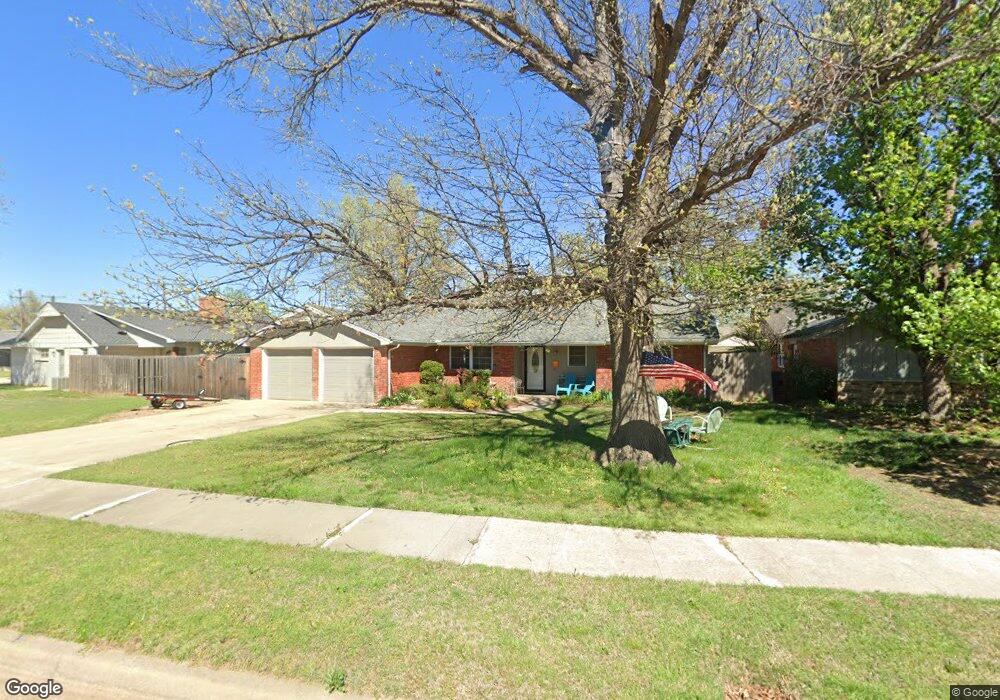
10316 Northland Rd Oklahoma City, OK 73120
Estimated Value: $273,222 - $293,000
3
Beds
2
Baths
1,846
Sq Ft
$152/Sq Ft
Est. Value
About This Home
This home is located at 10316 Northland Rd, Oklahoma City, OK 73120 and is currently estimated at $280,306, approximately $151 per square foot. 10316 Northland Rd is a home located in Oklahoma County with nearby schools including Ridgeview Elementary School, John Marshall Enterprise Middle School, and John Marshall Enterprise High School.
Ownership History
Date
Name
Owned For
Owner Type
Purchase Details
Closed on
Jan 22, 2021
Sold by
Siemens Manuel Ray
Bought by
Siemens Manuel Ray and Siemens William
Current Estimated Value
Home Financials for this Owner
Home Financials are based on the most recent Mortgage that was taken out on this home.
Original Mortgage
$133,000
Outstanding Balance
$97,225
Interest Rate
2.7%
Mortgage Type
New Conventional
Estimated Equity
$183,081
Purchase Details
Closed on
Feb 27, 2009
Sold by
Symes John Clayton and Suther Symes Christabel
Bought by
Siemens Manuel R and Siemens Katherine A
Home Financials for this Owner
Home Financials are based on the most recent Mortgage that was taken out on this home.
Original Mortgage
$130,585
Interest Rate
5.06%
Mortgage Type
FHA
Purchase Details
Closed on
Nov 30, 2004
Sold by
Hays Nancy K and Hays Jim R
Bought by
Symes John Clayton
Purchase Details
Closed on
Mar 12, 2004
Sold by
Hays Nancy K and Poush Nancy R
Bought by
Hays Nancy K
Create a Home Valuation Report for This Property
The Home Valuation Report is an in-depth analysis detailing your home's value as well as a comparison with similar homes in the area
Home Values in the Area
Average Home Value in this Area
Purchase History
| Date | Buyer | Sale Price | Title Company |
|---|---|---|---|
| Siemens Manuel Ray | -- | American Eagle Title Group | |
| Siemens Manuel Ray | -- | American Eagle Title Group | |
| Siemens Manuel R | $138,000 | Capitol Abstract & Title Co | |
| Symes John Clayton | $123,000 | Stewart Abstract & Title Of | |
| Hays Nancy K | -- | -- |
Source: Public Records
Mortgage History
| Date | Status | Borrower | Loan Amount |
|---|---|---|---|
| Open | Siemens Manuel Ray | $133,000 | |
| Closed | Siemens Manuel Ray | $133,000 | |
| Closed | Siemens Manuel R | $130,585 |
Source: Public Records
Tax History Compared to Growth
Tax History
| Year | Tax Paid | Tax Assessment Tax Assessment Total Assessment is a certain percentage of the fair market value that is determined by local assessors to be the total taxable value of land and additions on the property. | Land | Improvement |
|---|---|---|---|---|
| 2024 | $2,656 | $23,216 | $3,938 | $19,278 |
| 2023 | $2,656 | $22,110 | $3,942 | $18,168 |
| 2022 | $2,427 | $21,057 | $4,093 | $16,964 |
| 2021 | $2,244 | $20,055 | $4,001 | $16,054 |
| 2020 | $2,107 | $19,100 | $4,171 | $14,929 |
| 2019 | $2,015 | $18,191 | $4,152 | $14,039 |
| 2018 | $1,821 | $17,325 | $0 | $0 |
| 2017 | $1,694 | $17,269 | $3,300 | $13,969 |
| 2016 | $1,676 | $16,994 | $3,300 | $13,694 |
| 2015 | $1,636 | $16,549 | $3,300 | $13,249 |
| 2014 | $1,582 | $16,078 | $2,930 | $13,148 |
Source: Public Records
Map
Nearby Homes
- 10405 Major Ave
- 2924 Lakeside Dr
- 3009 Kent Dr
- 10816 Quail Cir
- 10813 Quail Cir
- 4400 Redbud Ln
- 4424 Redbud Ln
- 10416 Lakeside Dr
- 10900 Rock Ridge Rd
- 10605 Lakeside Dr
- 3120 Kent Dr
- 2716 Tottingham Rd
- 2912 Carlton Way
- 3012 Carlton Way
- 10508 Whitehaven Rd
- 3305 W Rock Creek Rd
- 11008 Blue Sage Rd
- 10512 Ridgeview Dr
- 11112 Rock Ridge Rd
- 11013 Blue Sage Rd
- 10312 Northland Rd
- 10320 Northland Rd
- 10308 Northland Rd
- 10317 Sunrise Blvd
- 10321 Sunrise Blvd
- 10313 Sunrise Blvd
- 3000 Sunset Ln
- 10309 Northland Rd
- 10313 Northland Rd
- 10304 Northland Rd
- 10309 Sunrise Blvd
- 2909 Northland Rd
- 2905 Northland Rd
- 3004 Sunset Ln
- 10305 Northland Rd
- 2913 Northland Rd
- 2901 Northland Rd
- 10305 Sunrise Blvd
- 10300 Northland Rd
- 10320 Sunrise Blvd