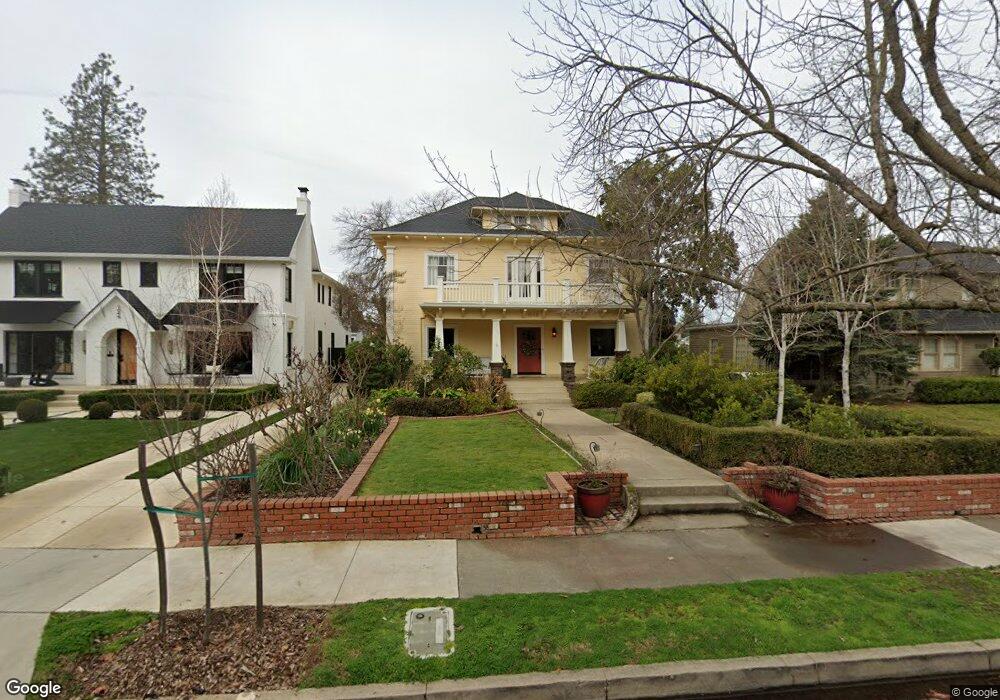
1032 38th St Sacramento, CA 95816
East Sacramento NeighborhoodEstimated Value: $659,000 - $1,374,000
4
Beds
3
Baths
3,346
Sq Ft
$336/Sq Ft
Est. Value
About This Home
This home is located at 1032 38th St, Sacramento, CA 95816 and is currently estimated at $1,125,262, approximately $336 per square foot. 1032 38th St is a home located in Sacramento County with nearby schools including David Lubin Elementary, Miwok Middle School, and Hiram W. Johnson High School.
Ownership History
Date
Name
Owned For
Owner Type
Purchase Details
Closed on
Nov 5, 2007
Sold by
Shock Paul T
Bought by
Shock Paul T and Shock Marjorie T
Current Estimated Value
Purchase Details
Closed on
May 8, 2001
Sold by
Shock Paul and Shock Karen
Bought by
Shock Paul
Home Financials for this Owner
Home Financials are based on the most recent Mortgage that was taken out on this home.
Original Mortgage
$372,700
Outstanding Balance
$139,130
Interest Rate
7.19%
Estimated Equity
$986,132
Purchase Details
Closed on
Apr 3, 2001
Sold by
Shock Karen
Bought by
Shock Paul T
Home Financials for this Owner
Home Financials are based on the most recent Mortgage that was taken out on this home.
Original Mortgage
$372,700
Outstanding Balance
$139,130
Interest Rate
7.19%
Estimated Equity
$986,132
Purchase Details
Closed on
Apr 16, 1997
Sold by
Montgomery Dennis L and Montgomery Kathleen C
Bought by
Shock Paul and Shock Karen
Home Financials for this Owner
Home Financials are based on the most recent Mortgage that was taken out on this home.
Original Mortgage
$214,600
Interest Rate
7.86%
Purchase Details
Closed on
Feb 25, 1997
Sold by
Montgomery Kathleen C
Bought by
Montgomery Kathleen C
Home Financials for this Owner
Home Financials are based on the most recent Mortgage that was taken out on this home.
Original Mortgage
$214,600
Interest Rate
7.86%
Create a Home Valuation Report for This Property
The Home Valuation Report is an in-depth analysis detailing your home's value as well as a comparison with similar homes in the area
Home Values in the Area
Average Home Value in this Area
Purchase History
| Date | Buyer | Sale Price | Title Company |
|---|---|---|---|
| Shock Paul T | -- | None Available | |
| Shock Paul | -- | -- | |
| Shock Paul T | -- | Financial Title Company | |
| Shock Paul | $300,000 | Chicago Title Co | |
| Montgomery Kathleen C | -- | -- |
Source: Public Records
Mortgage History
| Date | Status | Borrower | Loan Amount |
|---|---|---|---|
| Open | Shock Paul T | $372,700 | |
| Closed | Shock Paul | $214,600 | |
| Closed | Shock Paul | $55,400 |
Source: Public Records
Tax History Compared to Growth
Tax History
| Year | Tax Paid | Tax Assessment Tax Assessment Total Assessment is a certain percentage of the fair market value that is determined by local assessors to be the total taxable value of land and additions on the property. | Land | Improvement |
|---|---|---|---|---|
| 2025 | $6,618 | $565,849 | $193,311 | $372,538 |
| 2024 | $6,618 | $554,755 | $189,521 | $365,234 |
| 2023 | $6,461 | $543,878 | $185,805 | $358,073 |
| 2022 | $6,352 | $533,214 | $182,162 | $351,052 |
| 2021 | $6,051 | $522,760 | $178,591 | $344,169 |
| 2020 | $6,102 | $517,400 | $176,760 | $340,640 |
| 2019 | $5,971 | $507,256 | $173,295 | $333,961 |
| 2018 | $5,816 | $497,311 | $169,898 | $327,413 |
| 2017 | $5,735 | $487,561 | $166,567 | $320,994 |
| 2016 | $5,604 | $478,001 | $163,301 | $314,700 |
| 2015 | $5,517 | $470,822 | $160,849 | $309,973 |
| 2014 | $5,366 | $461,601 | $157,699 | $303,902 |
Source: Public Records
Map
Nearby Homes