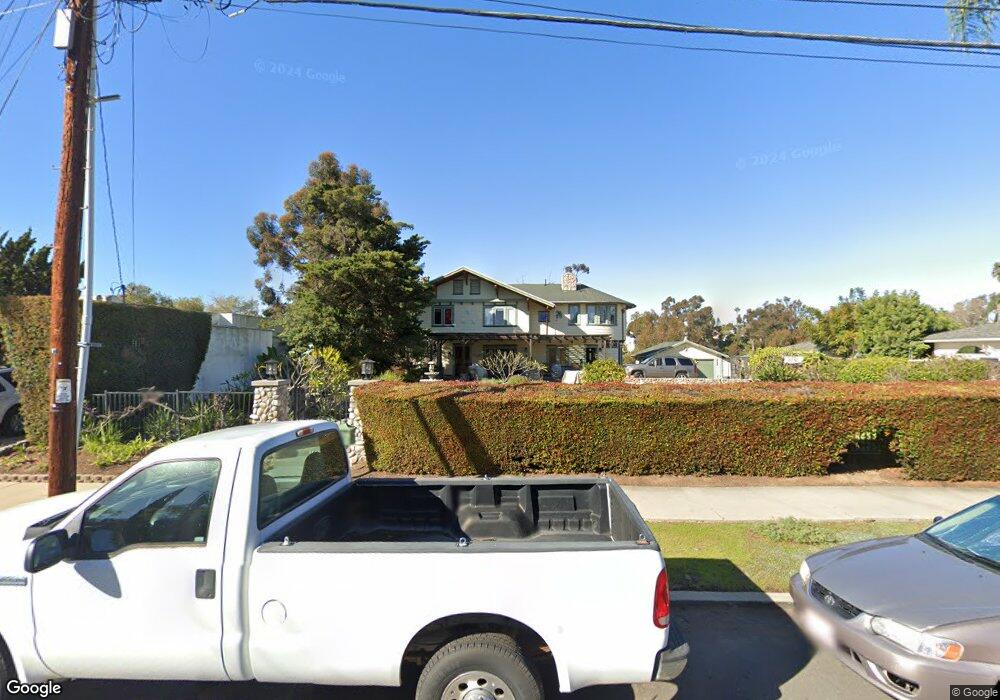
1032 Meade Ave San Diego, CA 92116
University Heights NeighborhoodEstimated Value: $1,892,000 - $2,110,000
3
Beds
3
Baths
3,100
Sq Ft
$652/Sq Ft
Est. Value
About This Home
This home is located at 1032 Meade Ave, San Diego, CA 92116 and is currently estimated at $2,022,334, approximately $652 per square foot. 1032 Meade Ave is a home located in San Diego County with nearby schools including Birney Elementary School, Roosevelt International Middle School, and Kindred Montessori.
Ownership History
Date
Name
Owned For
Owner Type
Purchase Details
Closed on
Mar 9, 2015
Sold by
Driver George
Bought by
Driver George and Driver Cynthia L
Current Estimated Value
Purchase Details
Closed on
May 24, 2013
Sold by
Driver George
Bought by
Driver George and Dirver Cynthia L
Home Financials for this Owner
Home Financials are based on the most recent Mortgage that was taken out on this home.
Original Mortgage
$286,000
Outstanding Balance
$199,352
Interest Rate
3.12%
Mortgage Type
New Conventional
Estimated Equity
$1,822,982
Purchase Details
Closed on
Dec 4, 2002
Sold by
Driver Cynthia L
Bought by
Driver George
Home Financials for this Owner
Home Financials are based on the most recent Mortgage that was taken out on this home.
Original Mortgage
$200,000
Interest Rate
6.06%
Purchase Details
Closed on
Jun 26, 1990
Create a Home Valuation Report for This Property
The Home Valuation Report is an in-depth analysis detailing your home's value as well as a comparison with similar homes in the area
Home Values in the Area
Average Home Value in this Area
Purchase History
| Date | Buyer | Sale Price | Title Company |
|---|---|---|---|
| Driver George | -- | None Available | |
| Driver George | -- | None Available | |
| Driver George | -- | Pacific Coast Title | |
| Driver George | -- | Commonwealth Land Title Co | |
| -- | $385,000 | -- |
Source: Public Records
Mortgage History
| Date | Status | Borrower | Loan Amount |
|---|---|---|---|
| Open | Driver George | $286,000 | |
| Closed | Driver George | $200,000 |
Source: Public Records
Tax History Compared to Growth
Tax History
| Year | Tax Paid | Tax Assessment Tax Assessment Total Assessment is a certain percentage of the fair market value that is determined by local assessors to be the total taxable value of land and additions on the property. | Land | Improvement |
|---|---|---|---|---|
| 2025 | $8,661 | $723,588 | $288,935 | $434,653 |
| 2024 | $8,661 | $709,401 | $283,270 | $426,131 |
| 2023 | $8,468 | $695,492 | $277,716 | $417,776 |
| 2022 | $8,242 | $681,856 | $272,271 | $409,585 |
| 2021 | $8,184 | $668,487 | $266,933 | $401,554 |
| 2020 | $8,084 | $661,633 | $264,196 | $397,437 |
| 2019 | $7,938 | $648,661 | $259,016 | $389,645 |
| 2018 | $7,420 | $635,943 | $253,938 | $382,005 |
| 2017 | $80 | $623,474 | $248,959 | $374,515 |
| 2016 | $6,902 | $592,250 | $244,078 | $348,172 |
| 2015 | $6,799 | $583,355 | $240,412 | $342,943 |
| 2014 | $6,691 | $571,929 | $235,703 | $336,226 |
Source: Public Records
Map
Nearby Homes
- 4324-26 Cleveland Ave
- 4314-18 Cleveland Ave
- 1026 Madison Ave
- 4259-61 Maryland St
- 1108 Madison Ave
- 4551 Maryland St
- 1028-30 Lincoln Ave
- 4438-44 Campus
- 4253 5th Ave
- 4260 6th Ave
- 4319 5th Ave
- 1237-39 Lincoln Ave
- 4180 Cleveland Ave Unit 10
- 521 Arbor Dr Unit 105
- 1414 Franciscan Way
- 4193 4th Ave
- 4655-4663 Campus Ave Unit 9, 11&12
- 4217 21 3rd Ave
- 4015 Richmond St
- 4209 15 3rd Ave