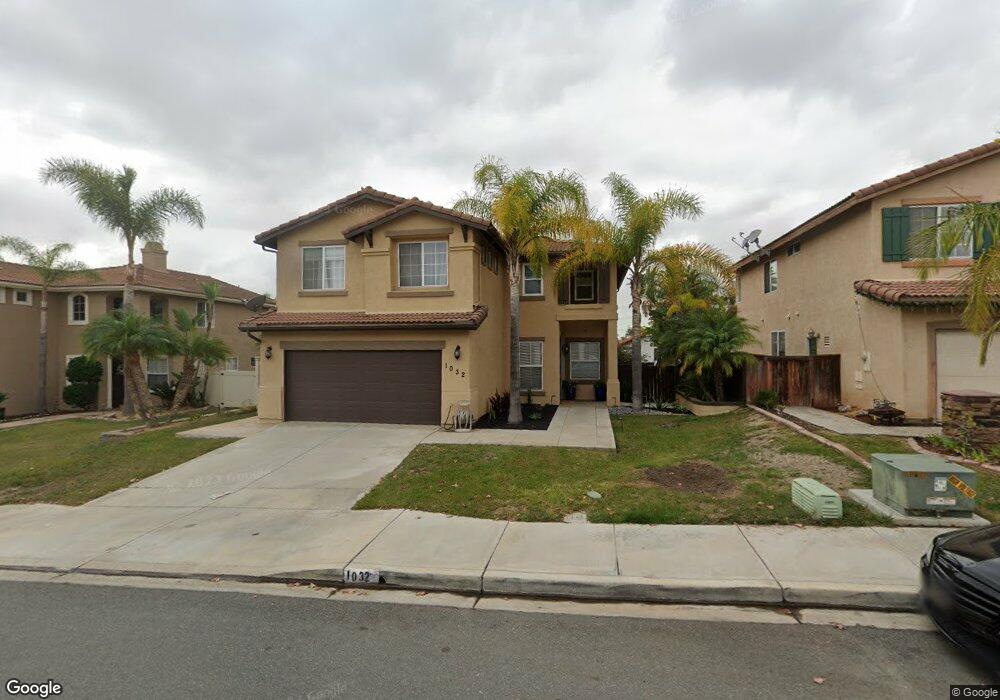
1032 Vista Oak Place Chula Vista, CA 91910
Rancho Del Rey NeighborhoodEstimated Value: $972,539 - $1,118,000
4
Beds
3
Baths
2,370
Sq Ft
$437/Sq Ft
Est. Value
About This Home
This home is located at 1032 Vista Oak Place, Chula Vista, CA 91910 and is currently estimated at $1,036,135, approximately $437 per square foot. 1032 Vista Oak Place is a home located in San Diego County with nearby schools including Casillas Elementary School, Rancho Del Rey Middle School, and Otay Ranch Senior High School.
Ownership History
Date
Name
Owned For
Owner Type
Purchase Details
Closed on
Nov 10, 2020
Sold by
Freiha George S and Freiha Paula
Bought by
Freiha George S and Freiha Paula
Current Estimated Value
Home Financials for this Owner
Home Financials are based on the most recent Mortgage that was taken out on this home.
Original Mortgage
$223,000
Outstanding Balance
$161,075
Interest Rate
2.8%
Mortgage Type
New Conventional
Estimated Equity
$875,060
Purchase Details
Closed on
May 16, 2008
Sold by
Freiha George S and Freiha Paula
Bought by
Freiha George S and Freiha Paula
Purchase Details
Closed on
May 20, 1999
Sold by
Western Pacific Housing Bella Nevona Llc
Bought by
Freiha George S and Freiha Paula
Home Financials for this Owner
Home Financials are based on the most recent Mortgage that was taken out on this home.
Original Mortgage
$180,750
Interest Rate
7.05%
Create a Home Valuation Report for This Property
The Home Valuation Report is an in-depth analysis detailing your home's value as well as a comparison with similar homes in the area
Home Values in the Area
Average Home Value in this Area
Purchase History
| Date | Buyer | Sale Price | Title Company |
|---|---|---|---|
| Freiha George S | -- | Wfg Title Co Of Ca San Diego | |
| Freiha George S | -- | None Available | |
| Freiha George S | $241,000 | First American Title |
Source: Public Records
Mortgage History
| Date | Status | Borrower | Loan Amount |
|---|---|---|---|
| Open | Freiha George S | $223,000 | |
| Closed | Freiha George S | $180,750 | |
| Closed | Freiha George S | $48,200 |
Source: Public Records
Tax History Compared to Growth
Tax History
| Year | Tax Paid | Tax Assessment Tax Assessment Total Assessment is a certain percentage of the fair market value that is determined by local assessors to be the total taxable value of land and additions on the property. | Land | Improvement |
|---|---|---|---|---|
| 2025 | $4,407 | $377,797 | $109,728 | $268,069 |
| 2024 | $4,407 | $370,390 | $107,577 | $262,813 |
| 2023 | $6,643 | $363,128 | $105,468 | $257,660 |
| 2022 | $6,440 | $356,008 | $103,400 | $252,608 |
| 2021 | $6,292 | $349,028 | $101,373 | $247,655 |
| 2020 | $6,140 | $345,450 | $100,334 | $245,116 |
| 2019 | $5,989 | $338,677 | $98,367 | $240,310 |
| 2018 | $5,877 | $332,038 | $96,439 | $235,599 |
| 2017 | $5,768 | $325,529 | $94,549 | $230,980 |
| 2016 | $5,602 | $319,147 | $92,696 | $226,451 |
| 2015 | $5,510 | $314,354 | $91,304 | $223,050 |
| 2014 | $5,389 | $308,197 | $89,516 | $218,681 |
Source: Public Records
Map
Nearby Homes
- 1029 Vista Oak Place
- 820 Chervil Ct
- 1057 Paseo Del Norte
- 1060 Via Sinuoso
- 1002 Cholla Place
- 909 Loma View
- 1112 Camino Del Rey
- 843 Calle Ciela Vista Unit 20
- 694 Calma Place
- 1008 Calma Dr
- 1337 Santa Olivia Rd
- 728 Cardona Ave
- 713 Esla Dr
- 1175 Santa Olivia Rd
- 793 Vada St Unit 2
- 1181 De Soto Ct Unit 54
- 578 Nantucket Dr
- 626 Mariposa Cir
- 1236 El Cortez Ct
- 640 E J St
- 1028 Vista Oak Place
- 1036 Vista Oak Place
- 1031 River Ash Dr
- 1027 River Ash Dr
- 1024 Vista Oak Place
- 1040 Vista Oak Place
- 1035 River Ash Dr
- 1023 River Ash Dr
- 1039 River Ash Dr
- 1033 Vista Oak Place
- 1019 River Ash Dr
- 1037 Vista Oak Place
- 1025 Vista Oak Place
- 1044 Vista Oak Place
- 1043 River Ash Dr
- 1041 Vista Oak Place
- 930 E J St
- 1047 River Ash Dr
- 1048 Vista Oak Place
- 1050 Vista Oak Place