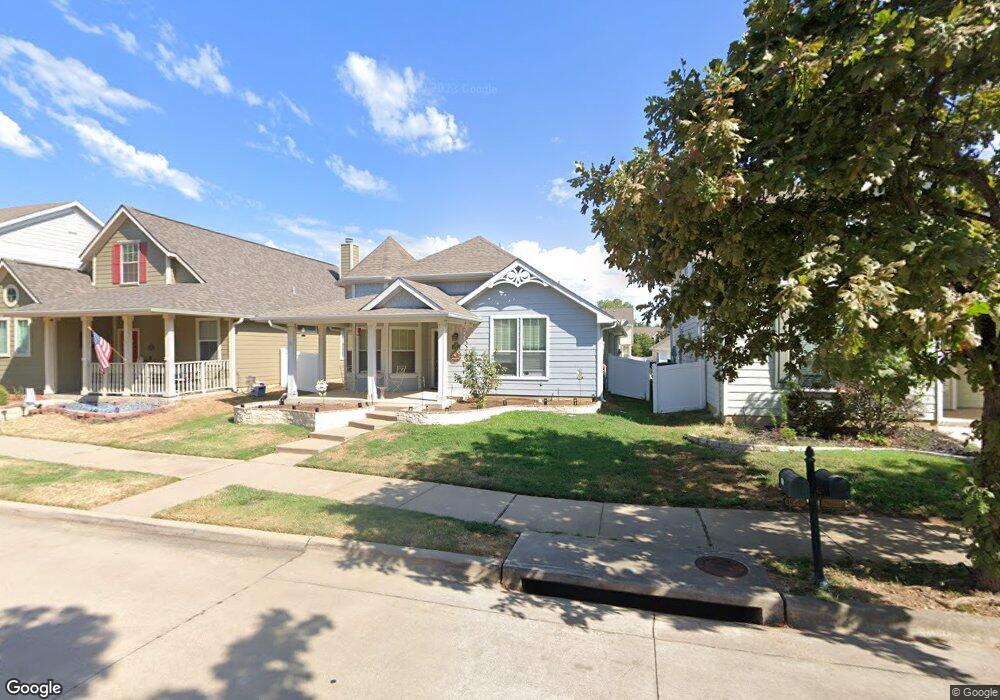
10349 Waterbury Dr Providence Village, TX 76227
Estimated Value: $277,000 - $292,000
3
Beds
2
Baths
1,304
Sq Ft
$218/Sq Ft
Est. Value
About This Home
This home is located at 10349 Waterbury Dr, Providence Village, TX 76227 and is currently estimated at $283,976, approximately $217 per square foot. 10349 Waterbury Dr is a home located in Denton County with nearby schools including Providence Elementary School, Rodriguez Middle School, and Ray E Braswell High School.
Ownership History
Date
Name
Owned For
Owner Type
Purchase Details
Closed on
Jun 1, 2015
Sold by
Northington Jesse
Bought by
Smaniotto Oscar and Bisaschi Marina
Current Estimated Value
Home Financials for this Owner
Home Financials are based on the most recent Mortgage that was taken out on this home.
Original Mortgage
$146,000
Outstanding Balance
$112,919
Interest Rate
3.71%
Mortgage Type
New Conventional
Estimated Equity
$171,057
Purchase Details
Closed on
Jun 29, 2004
Sold by
Choice Homes Inc
Bought by
Northington Jesse
Home Financials for this Owner
Home Financials are based on the most recent Mortgage that was taken out on this home.
Original Mortgage
$127,881
Interest Rate
6.26%
Mortgage Type
VA
Create a Home Valuation Report for This Property
The Home Valuation Report is an in-depth analysis detailing your home's value as well as a comparison with similar homes in the area
Home Values in the Area
Average Home Value in this Area
Purchase History
| Date | Buyer | Sale Price | Title Company |
|---|---|---|---|
| Smaniotto Oscar | -- | Attorney | |
| Northington Jesse | -- | -- |
Source: Public Records
Mortgage History
| Date | Status | Borrower | Loan Amount |
|---|---|---|---|
| Open | Smaniotto Oscar | $146,000 | |
| Previous Owner | Northington Jesse | $127,881 |
Source: Public Records
Tax History Compared to Growth
Tax History
| Year | Tax Paid | Tax Assessment Tax Assessment Total Assessment is a certain percentage of the fair market value that is determined by local assessors to be the total taxable value of land and additions on the property. | Land | Improvement |
|---|---|---|---|---|
| 2025 | $5,257 | $283,212 | $79,266 | $203,946 |
| 2024 | $5,257 | $288,213 | $79,266 | $208,947 |
| 2023 | $5,932 | $318,451 | $79,266 | $239,185 |
| 2022 | $5,711 | $263,917 | $60,050 | $203,867 |
| 2021 | $5,121 | $212,959 | $44,437 | $168,522 |
| 2020 | $4,846 | $195,182 | $44,437 | $150,745 |
| 2019 | $5,049 | $196,804 | $44,437 | $152,367 |
| 2018 | $4,860 | $186,087 | $44,437 | $141,650 |
| 2017 | $4,462 | $168,623 | $44,437 | $124,186 |
| 2016 | $4,404 | $151,095 | $36,030 | $115,065 |
| 2015 | $3,535 | $132,890 | $30,603 | $102,287 |
| 2014 | $3,535 | $125,703 | $30,603 | $95,100 |
| 2013 | -- | $107,896 | $30,603 | $77,293 |
Source: Public Records
Map
Nearby Homes
- 10228 Waterbury Dr
- 1925 Ventasso Blvd
- 1905 Ventasso Blvd
- 1857 Ventasso Blvd
- 1837 Ventasso Blvd
- 1853 Ventasso Blvd
- 1909 Ventasso Blvd
- 3521 Aster Ln
- 3537 Aster Ln
- 3529 Aster Ln
- 3549 Bar Claims St
- 3532 Bar Claims St
- 3521 Bar Claims St
- 1330 Portsmouth Dr
- 1345 Portsmouth Dr
- 1345 Kingston Place
- 10361 Cedar Lake Dr
- 1220 Kingston Place
- 10340 Cedar Lake Dr
- 10353 Waterbury Dr
- 10345 Waterbury Dr
- 10341 Waterbury Dr
- 1030 Catskill Dr
- 1330 Oakcrest Dr
- 1020 Catskill Dr
- 1040 Catskill Dr
- 1326 Oakcrest Dr
- 1322 Oakcrest Dr
- 10354 Waterbury Dr
- 10337 Waterbury Dr
- 10350 Waterbury Dr
- 1400 Oakcrest Dr
- 1010 Catskill Dr
- 1318 Oakcrest Dr
- 10342 Waterbury Dr
- 10333 Waterbury Dr
- 1404 Oakcrest Dr
- 1000 Catskill Dr
- 1314 Oakcrest Dr