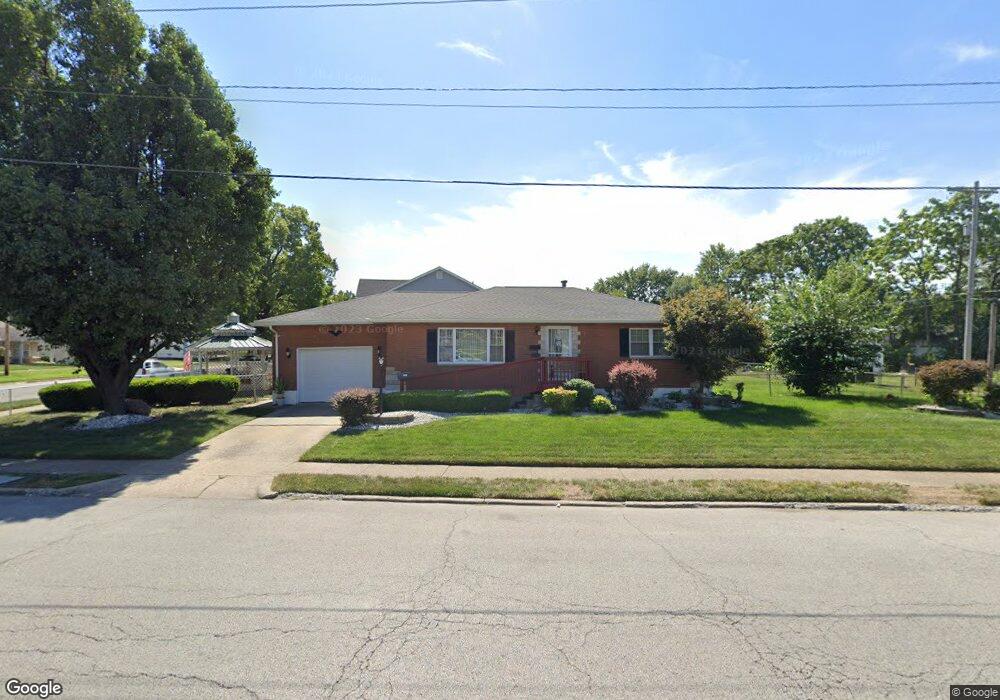
1035 Alton Ave Madison, IL 62060
Estimated Value: $76,000 - $117,000
2
Beds
2
Baths
1,148
Sq Ft
$82/Sq Ft
Est. Value
About This Home
This home is located at 1035 Alton Ave, Madison, IL 62060 and is currently estimated at $94,154, approximately $82 per square foot. 1035 Alton Ave is a home located in Madison County with nearby schools including Bernard Long Elementary School, Madison Senior High School, and Rivers of Life Christian School.
Ownership History
Date
Name
Owned For
Owner Type
Purchase Details
Closed on
Oct 27, 2014
Sold by
Smith Teresa R and Grzywacz Ronald L
Bought by
Glasper Wilbert and Glasper Gussie
Current Estimated Value
Home Financials for this Owner
Home Financials are based on the most recent Mortgage that was taken out on this home.
Original Mortgage
$66,600
Outstanding Balance
$51,484
Interest Rate
4.25%
Mortgage Type
New Conventional
Estimated Equity
$42,670
Purchase Details
Closed on
Dec 30, 2009
Sold by
Wiley Justin D and Fletcher Dwight E
Bought by
Smith Teresa R
Purchase Details
Closed on
May 13, 2005
Sold by
Mcgee Richard
Bought by
Wiley Justin D and Fletcher Dwight E
Home Financials for this Owner
Home Financials are based on the most recent Mortgage that was taken out on this home.
Original Mortgage
$63,437
Interest Rate
6.05%
Mortgage Type
FHA
Create a Home Valuation Report for This Property
The Home Valuation Report is an in-depth analysis detailing your home's value as well as a comparison with similar homes in the area
Home Values in the Area
Average Home Value in this Area
Purchase History
| Date | Buyer | Sale Price | Title Company |
|---|---|---|---|
| Glasper Wilbert | $80,000 | Pontoon Title Company | |
| Smith Teresa R | $73,000 | Metro Title & Escrow Company | |
| Wiley Justin D | $69,500 | Metro Title & Escrow Co |
Source: Public Records
Mortgage History
| Date | Status | Borrower | Loan Amount |
|---|---|---|---|
| Open | Glasper Wilbert | $66,600 | |
| Previous Owner | Wiley Justin D | $63,437 |
Source: Public Records
Tax History Compared to Growth
Tax History
| Year | Tax Paid | Tax Assessment Tax Assessment Total Assessment is a certain percentage of the fair market value that is determined by local assessors to be the total taxable value of land and additions on the property. | Land | Improvement |
|---|---|---|---|---|
| 2024 | $1,853 | $26,090 | $2,680 | $23,410 |
| 2023 | $1,853 | $22,860 | $2,350 | $20,510 |
| 2022 | $1,550 | $20,210 | $2,080 | $18,130 |
| 2021 | $1,169 | $19,040 | $1,960 | $17,080 |
| 2020 | $1,138 | $18,630 | $1,920 | $16,710 |
| 2019 | $1,176 | $18,960 | $1,950 | $17,010 |
| 2018 | $1,273 | $22,290 | $2,290 | $20,000 |
| 2017 | $975 | $22,520 | $2,310 | $20,210 |
| 2016 | $981 | $22,520 | $2,310 | $20,210 |
| 2015 | $1,599 | $21,830 | $2,240 | $19,590 |
| 2014 | $1,599 | $17,930 | $2,240 | $15,690 |
| 2013 | $1,599 | $22,090 | $2,270 | $19,820 |
Source: Public Records
Map
Nearby Homes
- 805 Iowa St
- 1821 Edwardsville Rd
- 2000 Meridian Ave
- 1348 Madison Ave
- - State St
- 1907 Rhodes St
- 1534 7th St
- 025.001 McCambridge Ave
- 1437 Grand Ave
- 1610 5th St
- 1720 5th St
- 2013 4th St
- 1225 Douglas St
- 305 Meredocia St
- 1832 Cleveland Blvd
- 2013 Grand Ave Unit A,B,A,B
- 2108 Washington Ave
- 1911 Benton St
- 2147 Lee Ave
- 2117 Edison Ave
- 1031 Alton Ave
- 1027 Alton Ave
- 1042 Washington Ave
- 1036 Washington Ave
- 1025 Alton Ave
- 1034 Washington Ave
- 1050 Washington Ave
- 1200 Alton Ave
- 1030 Alton Ave
- 1032 Washington Ave
- 1204 Alton Ave
- 1021 Alton Ave
- 1030 Washington Ave
- 1026 Alton Ave
- 1206 Alton Ave
- 1022 Alton Ave
- 1024 Washington Ave
- 1017 Alton Ave
- 1018 Alton Ave
- 1028 Washington Ave