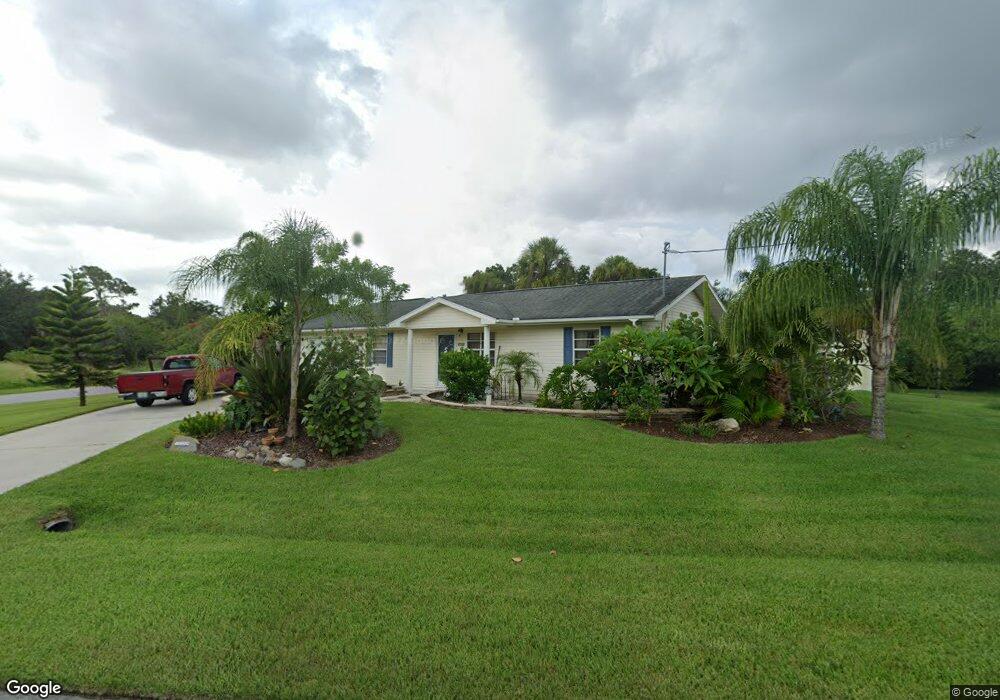
1035 March Dr Port Charlotte, FL 33953
Northwest Port Charlotte NeighborhoodEstimated Value: $212,721 - $268,000
3
Beds
2
Baths
1,176
Sq Ft
$205/Sq Ft
Est. Value
About This Home
This home is located at 1035 March Dr, Port Charlotte, FL 33953 and is currently estimated at $241,430, approximately $205 per square foot. 1035 March Dr is a home located in Charlotte County with nearby schools including Liberty Elementary School, Murdock Middle School, and Port Charlotte High School.
Ownership History
Date
Name
Owned For
Owner Type
Purchase Details
Closed on
Apr 10, 2007
Sold by
Deperna Janice and Jacobs John R
Bought by
Durovcsik Michael J and Romeo Durovcsik Susan A
Current Estimated Value
Home Financials for this Owner
Home Financials are based on the most recent Mortgage that was taken out on this home.
Original Mortgage
$118,000
Outstanding Balance
$71,150
Interest Rate
6.1%
Mortgage Type
Purchase Money Mortgage
Estimated Equity
$170,280
Purchase Details
Closed on
Mar 4, 2005
Sold by
Becker Norma and Norma Becker Revocable Trust
Bought by
Deperna Janice and Jacobs John R
Home Financials for this Owner
Home Financials are based on the most recent Mortgage that was taken out on this home.
Original Mortgage
$93,750
Interest Rate
5.61%
Mortgage Type
Purchase Money Mortgage
Purchase Details
Closed on
Feb 26, 2004
Sold by
Elarton Janet A and Elarton Norman C
Bought by
Bedker Norma and Norman Becker Rev Tr
Create a Home Valuation Report for This Property
The Home Valuation Report is an in-depth analysis detailing your home's value as well as a comparison with similar homes in the area
Home Values in the Area
Average Home Value in this Area
Purchase History
| Date | Buyer | Sale Price | Title Company |
|---|---|---|---|
| Durovcsik Michael J | $136,000 | Conveyance Title & Escrow Ll | |
| Deperna Janice | $125,000 | Chelsea Title Company | |
| Bedker Norma | $105,000 | -- |
Source: Public Records
Mortgage History
| Date | Status | Borrower | Loan Amount |
|---|---|---|---|
| Open | Durovcsik Michael J | $118,000 | |
| Previous Owner | Deperna Janice | $93,750 |
Source: Public Records
Tax History Compared to Growth
Tax History
| Year | Tax Paid | Tax Assessment Tax Assessment Total Assessment is a certain percentage of the fair market value that is determined by local assessors to be the total taxable value of land and additions on the property. | Land | Improvement |
|---|---|---|---|---|
| 2023 | $1,106 | $45,640 | $0 | $0 |
| 2022 | $1,046 | $44,311 | $0 | $0 |
| 2021 | $1,027 | $43,020 | $0 | $0 |
| 2020 | $987 | $42,426 | $0 | $0 |
| 2019 | $912 | $41,472 | $0 | $0 |
| 2018 | $836 | $40,699 | $0 | $0 |
| 2017 | $820 | $39,862 | $0 | $0 |
| 2016 | $805 | $39,042 | $0 | $0 |
| 2015 | $781 | $38,771 | $0 | $0 |
| 2014 | $664 | $38,463 | $0 | $0 |
Source: Public Records
Map
Nearby Homes
- 12117 Fiske Ave
- 1144 Anaheim St
- 1200 Anaheim St
- 12060 Eisenhower Dr
- 1100 March Dr
- 1108 March Dr
- 1114 March Dr
- 1030 Beekman Cir
- 1114 Campbell St
- 1225 Beekman Cir
- 1217 Beekman Cir
- 12196 Kraft Ave
- 12042 Kraft Ave
- 12090 Kraft Ave
- 12147 Kraft Ave
- 1188 Beekman Cir
- 12266 Defender Dr
- 12107 Judson Ave
- 12073 Judson Ave
- 12253 Endicott Ln