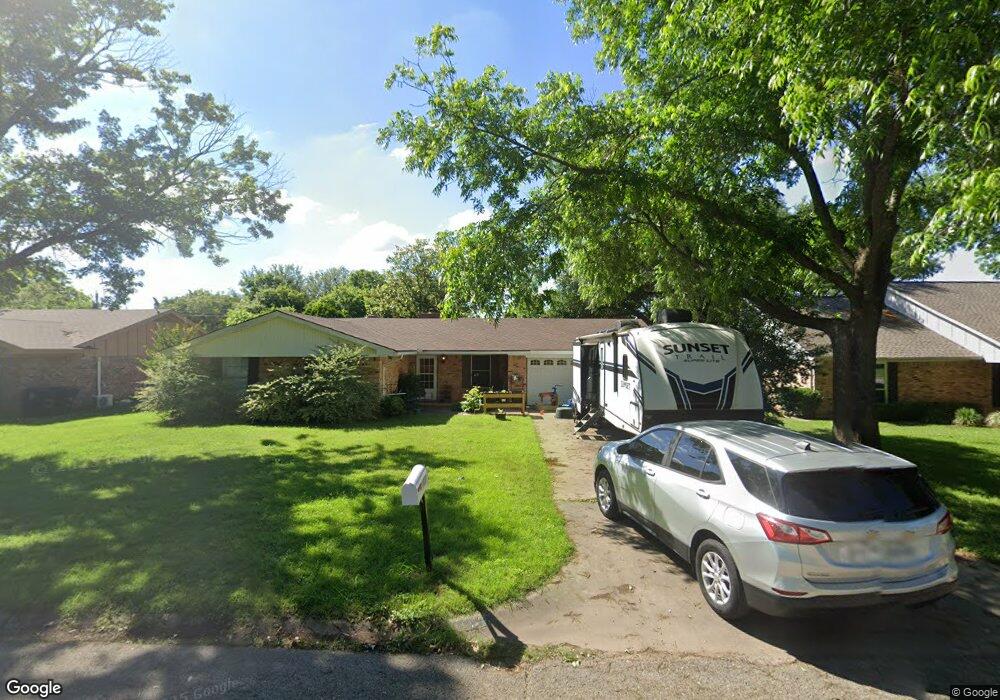
1037 Princeton Place Cleburne, TX 76033
Estimated Value: $223,258 - $248,000
3
Beds
2
Baths
1,388
Sq Ft
$170/Sq Ft
Est. Value
About This Home
This home is located at 1037 Princeton Place, Cleburne, TX 76033 and is currently estimated at $236,315, approximately $170 per square foot. 1037 Princeton Place is a home located in Johnson County with nearby schools including Coleman Elementary School, A.D. Wheat Middle School, and Cleburne High School.
Ownership History
Date
Name
Owned For
Owner Type
Purchase Details
Closed on
Jun 14, 2017
Sold by
Barnes Christopher A and Legros Laurent Andre
Bought by
Barnes Christopher A
Current Estimated Value
Purchase Details
Closed on
Jul 16, 2015
Sold by
Jenkins Ken and The Estate Of Otelia Clara She
Bought by
Phillips Dwight G and Phillips Carole E
Home Financials for this Owner
Home Financials are based on the most recent Mortgage that was taken out on this home.
Original Mortgage
$57,600
Outstanding Balance
$45,256
Interest Rate
4.08%
Mortgage Type
Purchase Money Mortgage
Estimated Equity
$191,059
Purchase Details
Closed on
Jul 5, 2011
Sold by
Klenow Edward
Bought by
The Bank Of New York Mellon and Novastar Mortgage Funding Trust Series 2
Purchase Details
Closed on
Apr 14, 2010
Sold by
Hanley Sue Anna
Bought by
Bohannon Joan L Douglas
Create a Home Valuation Report for This Property
The Home Valuation Report is an in-depth analysis detailing your home's value as well as a comparison with similar homes in the area
Home Values in the Area
Average Home Value in this Area
Purchase History
| Date | Buyer | Sale Price | Title Company |
|---|---|---|---|
| Barnes Christopher A | -- | Lawyers Title | |
| Phillips Dwight G | -- | None Available | |
| The Bank Of New York Mellon | $53,250 | None Available | |
| Bohannon Joan L Douglas | -- | None Available |
Source: Public Records
Mortgage History
| Date | Status | Borrower | Loan Amount |
|---|---|---|---|
| Open | Phillips Dwight G | $57,600 |
Source: Public Records
Tax History Compared to Growth
Tax History
| Year | Tax Paid | Tax Assessment Tax Assessment Total Assessment is a certain percentage of the fair market value that is determined by local assessors to be the total taxable value of land and additions on the property. | Land | Improvement |
|---|---|---|---|---|
| 2025 | $4,335 | $194,412 | $47,500 | $146,912 |
| 2024 | $4,335 | $194,412 | $47,500 | $146,912 |
| 2023 | $4,326 | $194,412 | $47,500 | $146,912 |
| 2022 | $4,440 | $177,433 | $47,500 | $129,933 |
| 2021 | $3,558 | $136,362 | $29,500 | $106,862 |
| 2020 | $3,515 | $126,844 | $20,000 | $106,844 |
| 2019 | $3,748 | $126,844 | $20,000 | $106,844 |
| 2018 | $3,449 | $116,676 | $26,500 | $90,176 |
| 2017 | $3,196 | $108,564 | $20,625 | $87,939 |
| 2016 | $2,636 | $89,532 | $20,625 | $68,907 |
| 2015 | $2,311 | $89,532 | $20,625 | $68,907 |
| 2014 | $2,311 | $86,694 | $20,625 | $66,069 |
Source: Public Records
Map
Nearby Homes
- 1102 Lena St
- 604 Mcanear St
- 1016 Sheridan Ln
- 1300 Belvon Place
- 1006 Princeton Place
- 618 Woodard Ave
- 106 Glen Rose Ave
- 311 N Pendell Ave
- 1307 Joslin St
- 1419 Quail Creek Dr
- Iverson 1 Plan at Trail Creek
- Hanover Plan at Trail Creek
- Devin Plan at Trail Creek
- Newcastle Plan at Trail Creek
- Sherwood Plan at Trail Creek
- Essex Plan at Trail Creek
- Cambria 1 Plan at Trail Creek
- 1102 Holly St
- 1401 Quail Creek Dr
- 1123 Bales St
- 1035 Princeton Place
- 1039 Princeton Place
- 1120 Sheridan Ln
- 1033 Princeton Place
- 1122 Sheridan Ln
- 1118 Sheridan Ln
- 1036 Princeton Place
- 1034 Princeton Place
- 1038 Princeton Place
- 1116 Sheridan Ln
- 1201 Princeton Place
- 1031 Princeton Place
- 1032 Princeton Place
- 1202 Sheridan Ln
- 1002 Lena St
- 1114 Sheridan Ln
- 1203 Princeton Place
- 1029 Princeton Place
- 1030 Princeton Place
- 1004 Lena St