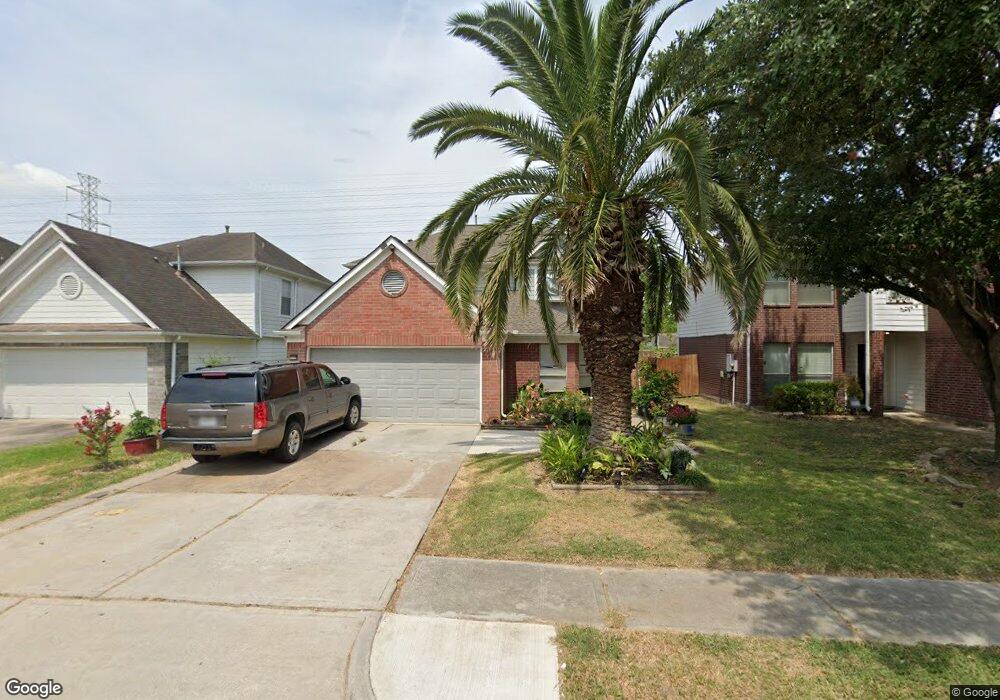
1039 Pennygent Ln Channelview, TX 77530
Estimated Value: $277,744 - $302,000
3
Beds
3
Baths
2,442
Sq Ft
$118/Sq Ft
Est. Value
About This Home
This home is located at 1039 Pennygent Ln, Channelview, TX 77530 and is currently estimated at $287,436, approximately $117 per square foot. 1039 Pennygent Ln is a home located in Harris County with nearby schools including Channelview High School, Family Christian Academy, and Creative Corner.
Ownership History
Date
Name
Owned For
Owner Type
Purchase Details
Closed on
Jul 17, 2017
Sold by
Lazo Josue G
Bought by
Remirez Jose Alfredo and Reynaga Martha E
Current Estimated Value
Home Financials for this Owner
Home Financials are based on the most recent Mortgage that was taken out on this home.
Original Mortgage
$146,400
Outstanding Balance
$121,801
Interest Rate
3.94%
Mortgage Type
New Conventional
Estimated Equity
$165,636
Purchase Details
Closed on
Apr 13, 2017
Sold by
Hsbc Bank Usa National Association
Bought by
Lazo Josue G
Purchase Details
Closed on
Oct 6, 2015
Sold by
Thompson Rosemary and Thompson Timothy E
Bought by
Hsbc Bank Usa Na
Purchase Details
Closed on
Dec 16, 1999
Sold by
Long Lake Ltd
Bought by
Thompson Timothy E and Thompson Rosemary
Home Financials for this Owner
Home Financials are based on the most recent Mortgage that was taken out on this home.
Original Mortgage
$76,700
Interest Rate
9.37%
Create a Home Valuation Report for This Property
The Home Valuation Report is an in-depth analysis detailing your home's value as well as a comparison with similar homes in the area
Home Values in the Area
Average Home Value in this Area
Purchase History
| Date | Buyer | Sale Price | Title Company |
|---|---|---|---|
| Remirez Jose Alfredo | -- | Capital Title | |
| Lazo Josue G | -- | None Available | |
| Hsbc Bank Usa Na | $61,000 | None Available | |
| Thompson Timothy E | -- | American Title Co |
Source: Public Records
Mortgage History
| Date | Status | Borrower | Loan Amount |
|---|---|---|---|
| Open | Remirez Jose Alfredo | $146,400 | |
| Previous Owner | Thompson Timothy E | $76,700 |
Source: Public Records
Tax History Compared to Growth
Tax History
| Year | Tax Paid | Tax Assessment Tax Assessment Total Assessment is a certain percentage of the fair market value that is determined by local assessors to be the total taxable value of land and additions on the property. | Land | Improvement |
|---|---|---|---|---|
| 2025 | $5,822 | $294,565 | $34,237 | $260,328 |
| 2024 | $5,822 | $284,836 | $34,237 | $250,599 |
| 2023 | $5,822 | $306,849 | $34,237 | $272,612 |
| 2022 | $6,292 | $264,665 | $34,237 | $230,428 |
| 2021 | $5,834 | $231,707 | $34,237 | $197,470 |
| 2020 | $5,351 | $194,467 | $31,041 | $163,426 |
| 2019 | $5,478 | $191,500 | $31,041 | $160,459 |
| 2018 | $2,420 | $173,374 | $31,041 | $142,333 |
| 2017 | $4,334 | $158,354 | $22,825 | $135,529 |
| 2016 | $3,940 | $146,964 | $18,260 | $128,704 |
| 2015 | $2,078 | $135,073 | $14,836 | $120,237 |
| 2014 | $2,078 | $119,003 | $11,412 | $107,591 |
Source: Public Records
Map
Nearby Homes
- 1102 Heathfield Dr
- 1034 Littleport Ln
- 1123 Maclesby Ln
- 909 Pennygent Ln
- 14951 Scotter Dr
- 15122 Sheffield Terrace
- 1323 Padstow Ln
- 14918 Silver Green Dr S
- 1343 Littleport Ln
- 827 Dondell St
- 14835 Scotter Dr
- 1330 Stevenage Ln
- 727 Doncrest St
- 730 Doncrest St
- 814 Deercrest St
- 830 Stonyridge St
- 726 Brookview St
- 14806 Beaconsfield Dr
- 1303 Sterling Green Ct
- 707 Doncrest St
- 1043 Pennygent Ln
- 1035 Pennygent Ln
- 1047 Pennygent Ln
- 1031 Pennygent Ln
- 1051 Pennygent Ln
- 1027 Pennygent Ln
- 1055 Pennygent Ln
- 1023 Pennygent Ln
- 1038 Pennygent Ln
- 1042 Pennygent Ln
- 1046 Pennygent Ln
- 1034 Pennygent Ln
- 1050 Pennygent Ln
- 1030 Pennygent Ln
- 1059 Pennygent Ln
- 1019 Pennygent Ln
- 1026 Heathfield Dr
- 1030 Heathfield Dr
- 1022 Heathfield Dr
- 1026 Pennygent Ln