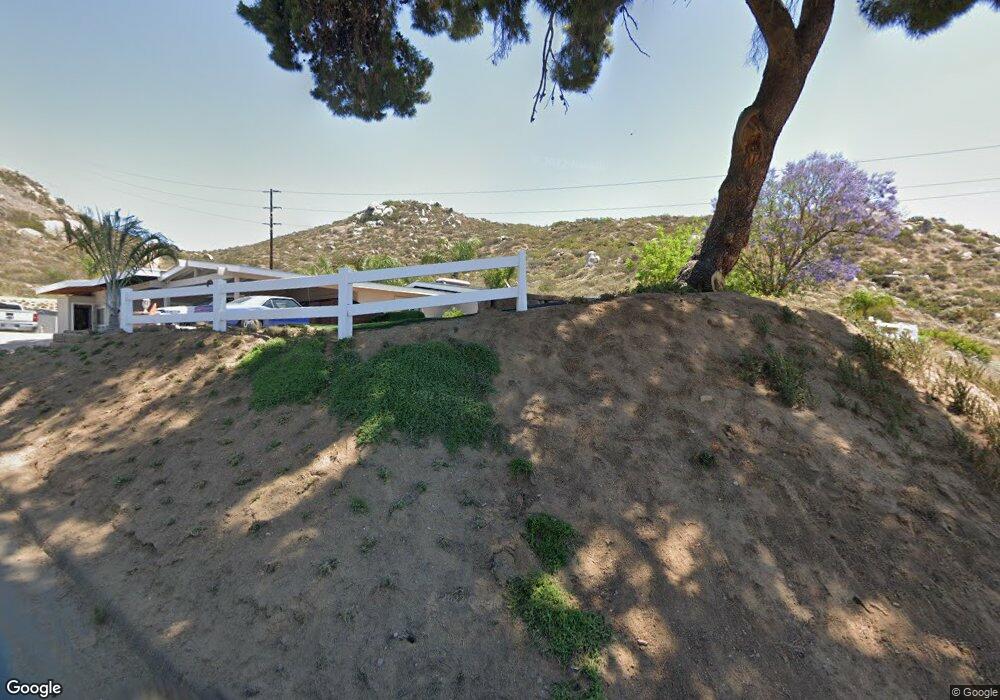
10391 Mountain View Ln Lakeside, CA 92040
Estimated Value: $829,000 - $871,000
3
Beds
2
Baths
1,771
Sq Ft
$480/Sq Ft
Est. Value
About This Home
This home is located at 10391 Mountain View Ln, Lakeside, CA 92040 and is currently estimated at $849,633, approximately $479 per square foot. 10391 Mountain View Ln is a home located in San Diego County with nearby schools including Lakeside Farms Elementary School, Lakeside Middle School, and Santana High School.
Ownership History
Date
Name
Owned For
Owner Type
Purchase Details
Closed on
Mar 15, 2013
Sold by
Schutza Scott A
Bought by
Shutza Scott A
Current Estimated Value
Home Financials for this Owner
Home Financials are based on the most recent Mortgage that was taken out on this home.
Original Mortgage
$190,000
Outstanding Balance
$133,774
Interest Rate
3.49%
Mortgage Type
New Conventional
Estimated Equity
$715,859
Purchase Details
Closed on
Apr 5, 2012
Sold by
Schutza Charles Dennie and Schutza Eva Jeane
Bought by
Schutza Scott A
Purchase Details
Closed on
Jun 3, 2002
Sold by
Schutza Scott A
Bought by
Schutza Charles Dennie and Schutza Eva Jeane
Purchase Details
Closed on
Oct 27, 1999
Sold by
Lawrence Carol Anne
Bought by
Schutza Scott A
Home Financials for this Owner
Home Financials are based on the most recent Mortgage that was taken out on this home.
Original Mortgage
$216,000
Interest Rate
7.96%
Create a Home Valuation Report for This Property
The Home Valuation Report is an in-depth analysis detailing your home's value as well as a comparison with similar homes in the area
Home Values in the Area
Average Home Value in this Area
Purchase History
| Date | Buyer | Sale Price | Title Company |
|---|---|---|---|
| Shutza Scott A | -- | Accommodation | |
| Schutza Scott A | -- | Ticor Title | |
| Schutza Scott A | -- | None Available | |
| Schutza Charles Dennie | -- | -- | |
| Schutza Scott A | $270,000 | Fidelity National Title |
Source: Public Records
Mortgage History
| Date | Status | Borrower | Loan Amount |
|---|---|---|---|
| Open | Schutza Scott A | $190,000 | |
| Closed | Schutza Scott A | $216,000 |
Source: Public Records
Tax History Compared to Growth
Tax History
| Year | Tax Paid | Tax Assessment Tax Assessment Total Assessment is a certain percentage of the fair market value that is determined by local assessors to be the total taxable value of land and additions on the property. | Land | Improvement |
|---|---|---|---|---|
| 2025 | $5,010 | $414,965 | $153,688 | $261,277 |
| 2024 | $5,010 | $406,829 | $150,675 | $256,154 |
| 2023 | $4,834 | $398,853 | $147,721 | $251,132 |
| 2022 | $4,759 | $391,033 | $144,825 | $246,208 |
| 2021 | $4,692 | $383,367 | $141,986 | $241,381 |
| 2020 | $4,641 | $379,437 | $140,531 | $238,906 |
| 2019 | $4,560 | $371,998 | $137,776 | $234,222 |
| 2018 | $4,506 | $364,705 | $135,075 | $229,630 |
| 2017 | $4,445 | $357,555 | $132,427 | $225,128 |
| 2016 | $4,320 | $350,545 | $129,831 | $220,714 |
| 2015 | $4,292 | $345,280 | $127,881 | $217,399 |
| 2014 | $4,077 | $338,517 | $125,376 | $213,141 |
Source: Public Records
Map
Nearby Homes
- 11010 El Nopal
- 10410 Bosque Dr
- 11320 El Nopal Unit 5619
- 0 Santana St
- 11436 El Nopal
- 11034 Brookfield Ct
- 10103 Riverhill Ln
- 10252 Casa Ct
- 10703 Oak Creek Dr
- 0 Riverford Rd Unit 3
- 10651 Trigal Way
- 10443 Nate Way
- 10525 Flora Verda Ct
- 10534 Flora Verda Ct
- 10009 Santana Ranch Ln
- 10835 Sima Ct
- 11529 Woodside Ave
- 9717 Follett Dr
- 10661 King Phillip Ct
- 10323 Restful Ct
- 10381 Mountain View Ln
- 10359 Mountain View Ln
- 10355 Lozita Way
- 10361 Lozita Way
- 10349 Lozita Way
- 10343 Lozita Way
- 10367 Lozita Way
- 10337 Lozita Way
- 10331 Lozita Way
- 10373 Lozita Way
- 10337 Mountain View Ln
- 10325 Lozita Way
- 10346 Mountain View Ln
- 10319 Lozita Way
- 10356 Lozita Way
- 10350 Lozita Way
- 10362 Lozita Way
- 10344 Lozita Way
- 10374 Lozita Way
- 10338 Lozita Way