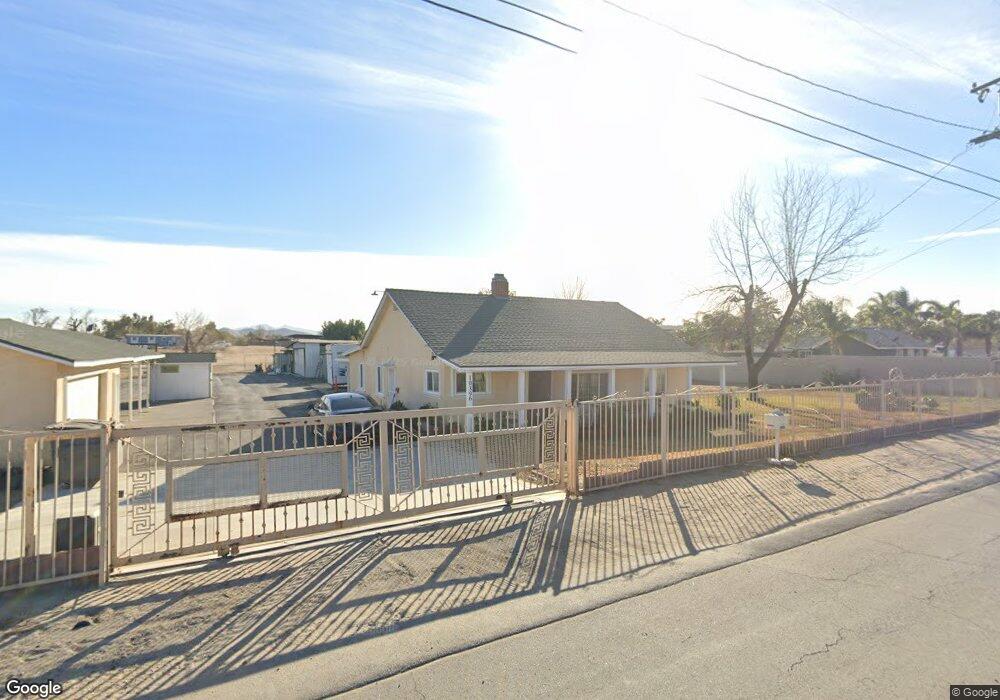
10396 48th St Jurupa Valley, CA 91752
Estimated Value: $629,000 - $784,457
2
Beds
2
Baths
1,404
Sq Ft
$493/Sq Ft
Est. Value
About This Home
This home is located at 10396 48th St, Jurupa Valley, CA 91752 and is currently estimated at $692,364, approximately $493 per square foot. 10396 48th St is a home located in Riverside County with nearby schools including Troth Street Elementary School, Mira Loma Middle School, and Jurupa Valley High School.
Ownership History
Date
Name
Owned For
Owner Type
Purchase Details
Closed on
Aug 23, 2003
Sold by
Lopez Jessie
Bought by
Lopez Jessie
Current Estimated Value
Home Financials for this Owner
Home Financials are based on the most recent Mortgage that was taken out on this home.
Original Mortgage
$76,845
Outstanding Balance
$35,434
Interest Rate
6.27%
Mortgage Type
Purchase Money Mortgage
Estimated Equity
$656,930
Purchase Details
Closed on
Jan 22, 2002
Sold by
Martin Daniel
Bought by
Lopez Jessie
Purchase Details
Closed on
Mar 2, 2000
Sold by
Beneficial Finance Corp
Bought by
Martin Daniel
Home Financials for this Owner
Home Financials are based on the most recent Mortgage that was taken out on this home.
Original Mortgage
$163,903
Interest Rate
8.34%
Mortgage Type
Purchase Money Mortgage
Purchase Details
Closed on
Sep 24, 1999
Sold by
Rasmussen Shirley J and Townsend Lena B
Bought by
Beneficial Finance Corp
Create a Home Valuation Report for This Property
The Home Valuation Report is an in-depth analysis detailing your home's value as well as a comparison with similar homes in the area
Home Values in the Area
Average Home Value in this Area
Purchase History
| Date | Buyer | Sale Price | Title Company |
|---|---|---|---|
| Lopez Jessie | -- | Chicago Title Co | |
| Lopez Jessie | -- | -- | |
| Lopez Jessie | -- | -- | |
| Martin Daniel | $165,000 | Orange Coast Title | |
| Beneficial Finance Corp | $125,000 | -- |
Source: Public Records
Mortgage History
| Date | Status | Borrower | Loan Amount |
|---|---|---|---|
| Open | Lopez Jessie | $76,845 | |
| Previous Owner | Martin Daniel | $163,903 |
Source: Public Records
Tax History Compared to Growth
Tax History
| Year | Tax Paid | Tax Assessment Tax Assessment Total Assessment is a certain percentage of the fair market value that is determined by local assessors to be the total taxable value of land and additions on the property. | Land | Improvement |
|---|---|---|---|---|
| 2025 | $3,053 | $283,613 | $147,717 | $135,896 |
| 2023 | $3,053 | $272,602 | $141,982 | $130,620 |
| 2022 | $3,003 | $267,258 | $139,199 | $128,059 |
| 2021 | $2,982 | $262,019 | $136,470 | $125,549 |
| 2020 | $2,956 | $259,333 | $135,071 | $124,262 |
| 2019 | $2,898 | $254,249 | $132,423 | $121,826 |
| 2018 | $2,806 | $249,265 | $129,827 | $119,438 |
| 2017 | $2,777 | $244,379 | $127,282 | $117,097 |
| 2016 | $2,740 | $239,588 | $124,787 | $114,801 |
| 2015 | $2,704 | $235,991 | $122,913 | $113,078 |
| 2014 | $2,520 | $231,370 | $120,506 | $110,864 |
Source: Public Records
Map
Nearby Homes
- 4795 Bain St
- 10457 50th St
- 10517 50th St
- 4900 Eclipse Ave
- 10538 54th St
- 9931 Union St
- 11129 Ryder Rd
- 4737 Hot Creek Rd
- 11101 Gemini Ct
- 11234 Owen Ct
- 9600 51st St
- 9567 51st St
- 4775 Wanamaker Dr
- 4052 Lindsay St
- 9745 55th St
- 5286 Trail Canyon Dr
- 4991 Graphite Creek Rd
- 5685 Ptolemy Way
- 11428 Humber Dr
- 9265 52nd St