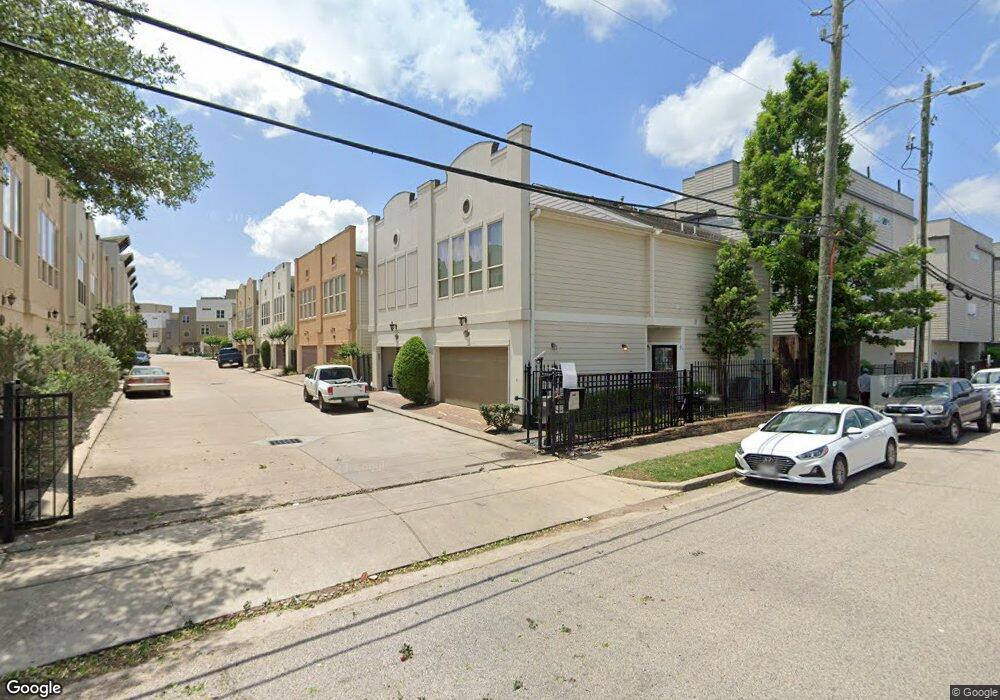
104 Riley Ln Houston, TX 77003
Second Ward NeighborhoodEstimated Value: $294,220 - $318,000
2
Beds
2
Baths
1,365
Sq Ft
$225/Sq Ft
Est. Value
About This Home
This home is located at 104 Riley Ln, Houston, TX 77003 and is currently estimated at $307,805, approximately $225 per square foot. 104 Riley Ln is a home located in Harris County with nearby schools including Burnet Elementary School, Yolanda Black Navarro Middle School, and Wheatley High School.
Ownership History
Date
Name
Owned For
Owner Type
Purchase Details
Closed on
Jan 15, 2019
Sold by
Dejong Shannon
Bought by
Dejong Shannon and Escobar Francisco
Current Estimated Value
Home Financials for this Owner
Home Financials are based on the most recent Mortgage that was taken out on this home.
Original Mortgage
$196,000
Outstanding Balance
$125,183
Interest Rate
4.6%
Mortgage Type
Stand Alone First
Estimated Equity
$182,622
Purchase Details
Closed on
May 14, 2008
Sold by
Bercon Ltd
Bought by
Dejong Shannon
Home Financials for this Owner
Home Financials are based on the most recent Mortgage that was taken out on this home.
Original Mortgage
$204,859
Interest Rate
5.86%
Mortgage Type
FHA
Create a Home Valuation Report for This Property
The Home Valuation Report is an in-depth analysis detailing your home's value as well as a comparison with similar homes in the area
Home Values in the Area
Average Home Value in this Area
Purchase History
| Date | Buyer | Sale Price | Title Company |
|---|---|---|---|
| Dejong Shannon | -- | None Available | |
| Dejong Shannon | -- | Startex Title Company |
Source: Public Records
Mortgage History
| Date | Status | Borrower | Loan Amount |
|---|---|---|---|
| Open | Dejong Shannon | $196,000 | |
| Closed | Dejong Shannon | $204,859 |
Source: Public Records
Tax History Compared to Growth
Tax History
| Year | Tax Paid | Tax Assessment Tax Assessment Total Assessment is a certain percentage of the fair market value that is determined by local assessors to be the total taxable value of land and additions on the property. | Land | Improvement |
|---|---|---|---|---|
| 2025 | $3,831 | $267,861 | $70,000 | $197,861 |
| 2024 | $3,831 | $280,235 | $70,000 | $210,235 |
| 2023 | $3,831 | $310,979 | $70,000 | $240,979 |
| 2022 | $6,524 | $277,385 | $70,000 | $207,385 |
| 2021 | $6,286 | $269,689 | $70,000 | $199,689 |
| 2020 | $6,821 | $265,232 | $70,000 | $195,232 |
| 2019 | $7,137 | $266,275 | $70,000 | $196,275 |
| 2018 | $5,065 | $263,821 | $70,000 | $193,821 |
| 2017 | $7,067 | $263,821 | $70,000 | $193,821 |
| 2016 | $6,953 | $263,821 | $70,000 | $193,821 |
| 2015 | $4,255 | $255,158 | $70,000 | $185,158 |
| 2014 | $4,255 | $232,251 | $70,000 | $162,251 |
Source: Public Records
Map
Nearby Homes
- 2415 Roufa Rd
- 3 N St Charles St F St
- 2412 Canal St Unit K
- 2414 Canal St Unit F
- 2414 Canal St Unit A
- 2414 Canal St
- 2503 Garrow St
- 2513 Garrow St
- 2501 Canal St
- 2504 Saltus St Unit 8
- 2422 Navigation Blvd Unit E
- 2602 Saltus St
- 2219 Runnels St
- 603 N Live Oak St
- 2515 Engelke St
- 2248 Ann St
- 2901 Preston St
- 319 N Nagle St
- 310 S Jensen Dr Unit 2
- 403 N Nagle St Unit B