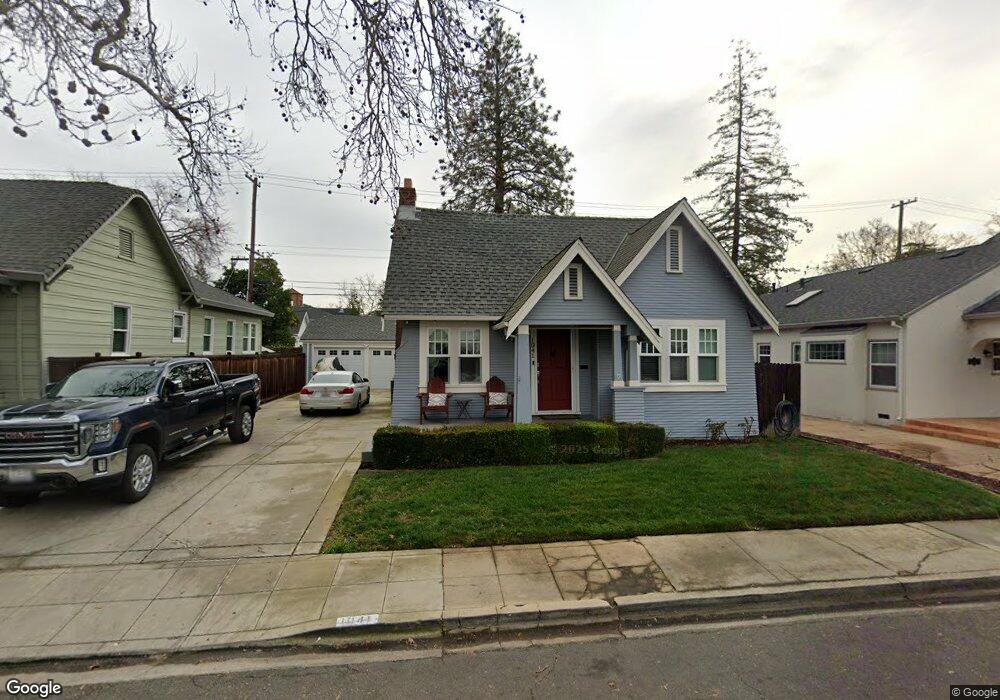
1041 37th St Sacramento, CA 95816
East Sacramento NeighborhoodEstimated Value: $473,000 - $656,000
2
Beds
2
Baths
1,246
Sq Ft
$469/Sq Ft
Est. Value
About This Home
This home is located at 1041 37th St, Sacramento, CA 95816 and is currently estimated at $583,930, approximately $468 per square foot. 1041 37th St is a home located in Sacramento County with nearby schools including David Lubin Elementary, Miwok Middle School, and Hiram W. Johnson High School.
Ownership History
Date
Name
Owned For
Owner Type
Purchase Details
Closed on
Jan 25, 2017
Sold by
Bettis Frances and Bettis Elias J
Bought by
Bettis Elias J
Current Estimated Value
Home Financials for this Owner
Home Financials are based on the most recent Mortgage that was taken out on this home.
Original Mortgage
$210,000
Interest Rate
4.16%
Mortgage Type
New Conventional
Purchase Details
Closed on
Feb 25, 2015
Sold by
Thompson Paula D and Bettis Gabriel M
Bought by
Bettis Elias J
Purchase Details
Closed on
Jun 22, 2000
Sold by
Thompson Jane A
Bought by
Thompson Jane A and Jane A Thompson Family Trust
Create a Home Valuation Report for This Property
The Home Valuation Report is an in-depth analysis detailing your home's value as well as a comparison with similar homes in the area
Home Values in the Area
Average Home Value in this Area
Purchase History
| Date | Buyer | Sale Price | Title Company |
|---|---|---|---|
| Bettis Elias J | -- | First American Title Company | |
| Bettis Elias J | -- | None Available | |
| Thompson Jane A | -- | -- |
Source: Public Records
Mortgage History
| Date | Status | Borrower | Loan Amount |
|---|---|---|---|
| Closed | Bettis Elias J | $210,000 |
Source: Public Records
Tax History Compared to Growth
Tax History
| Year | Tax Paid | Tax Assessment Tax Assessment Total Assessment is a certain percentage of the fair market value that is determined by local assessors to be the total taxable value of land and additions on the property. | Land | Improvement |
|---|---|---|---|---|
| 2025 | $5,135 | $442,697 | $275,815 | $166,882 |
| 2024 | $5,135 | $434,017 | $270,407 | $163,610 |
| 2023 | $5,012 | $425,507 | $265,105 | $160,402 |
| 2022 | $5,007 | $417,164 | $259,907 | $157,257 |
| 2021 | $4,769 | $408,985 | $254,811 | $154,174 |
| 2020 | $4,809 | $404,793 | $252,199 | $152,594 |
| 2019 | $4,707 | $396,856 | $247,254 | $149,602 |
| 2018 | $4,585 | $389,075 | $242,406 | $146,669 |
| 2017 | $4,388 | $369,682 | $237,653 | $132,029 |
| 2016 | $4,273 | $362,435 | $232,994 | $129,441 |
| 2015 | $4,210 | $37,252 | $10,436 | $26,816 |
| 2014 | $545 | $36,533 | $10,238 | $26,295 |
Source: Public Records
Map
Nearby Homes