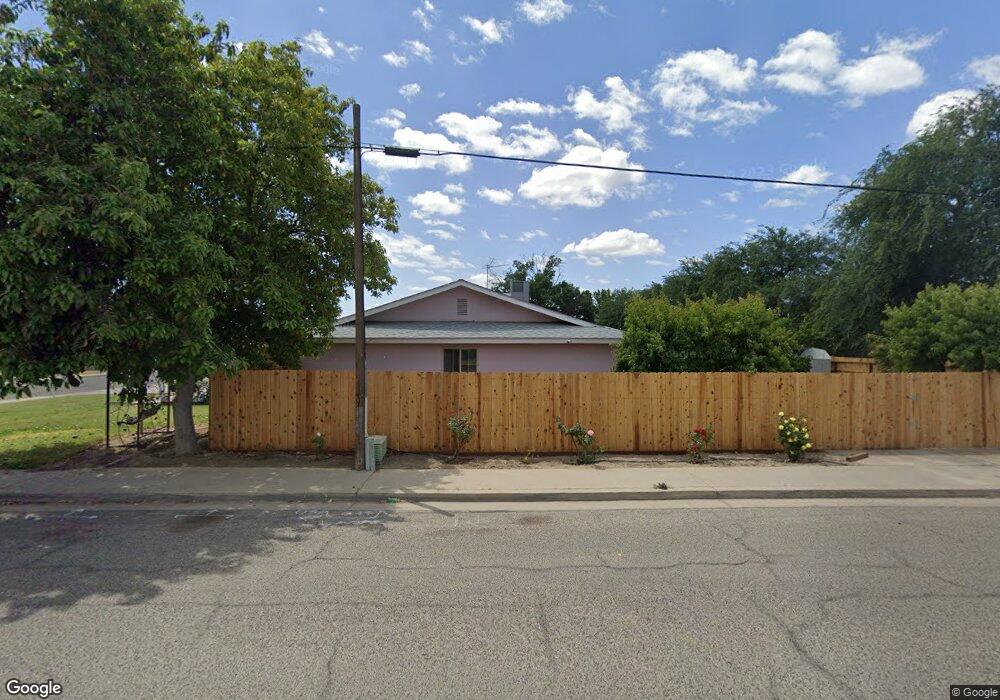
1041 Douglas St Porterville, CA 93257
Porterville Northwest NeighborhoodEstimated Value: $302,678 - $363,000
3
Beds
2
Baths
1,322
Sq Ft
$251/Sq Ft
Est. Value
About This Home
This home is located at 1041 Douglas St, Porterville, CA 93257 and is currently estimated at $332,170, approximately $251 per square foot. 1041 Douglas St is a home located in Tulare County with nearby schools including Westfield Elementary School, Sequoia Middle School, and Monache High School.
Ownership History
Date
Name
Owned For
Owner Type
Purchase Details
Closed on
Apr 25, 2024
Sold by
Gomez Federico and Gomez Cleofas
Bought by
Gomez Federico and Gomez Cleofas
Current Estimated Value
Purchase Details
Closed on
Oct 19, 2004
Sold by
Gomez Frederico
Bought by
Gomez Federico and Gomez Cleofas
Home Financials for this Owner
Home Financials are based on the most recent Mortgage that was taken out on this home.
Original Mortgage
$117,000
Interest Rate
5.69%
Mortgage Type
New Conventional
Purchase Details
Closed on
Jul 23, 2002
Sold by
Gomez Freddie C
Bought by
Gomez Frederico and Gomez Cleofas
Home Financials for this Owner
Home Financials are based on the most recent Mortgage that was taken out on this home.
Original Mortgage
$89,300
Interest Rate
6.6%
Purchase Details
Closed on
Dec 27, 1993
Sold by
Oakley James E
Bought by
Gomez Frederico and Gomez Cleofas
Home Financials for this Owner
Home Financials are based on the most recent Mortgage that was taken out on this home.
Original Mortgage
$72,100
Interest Rate
7.1%
Mortgage Type
FHA
Create a Home Valuation Report for This Property
The Home Valuation Report is an in-depth analysis detailing your home's value as well as a comparison with similar homes in the area
Home Values in the Area
Average Home Value in this Area
Purchase History
| Date | Buyer | Sale Price | Title Company |
|---|---|---|---|
| Gomez Federico | -- | None Listed On Document | |
| Gomez Federico | -- | Alliance Title Company | |
| Gomez Frederico | -- | Cuesta Title | |
| Gomez Frederico | $81,500 | Chicago Title Company |
Source: Public Records
Mortgage History
| Date | Status | Borrower | Loan Amount |
|---|---|---|---|
| Previous Owner | Gomez Federico | $117,000 | |
| Previous Owner | Gomez Frederico | $89,300 | |
| Previous Owner | Gomez Frederico | $72,100 |
Source: Public Records
Tax History Compared to Growth
Tax History
| Year | Tax Paid | Tax Assessment Tax Assessment Total Assessment is a certain percentage of the fair market value that is determined by local assessors to be the total taxable value of land and additions on the property. | Land | Improvement |
|---|---|---|---|---|
| 2025 | $1,387 | $137,736 | $40,399 | $97,337 |
| 2024 | $1,387 | $135,036 | $39,607 | $95,429 |
| 2023 | $1,384 | $132,389 | $38,831 | $93,558 |
| 2022 | $1,340 | $129,794 | $38,070 | $91,724 |
| 2021 | $1,323 | $127,249 | $37,324 | $89,925 |
| 2020 | $1,308 | $125,944 | $36,941 | $89,003 |
| 2019 | $1,283 | $123,475 | $36,217 | $87,258 |
| 2018 | $1,259 | $121,054 | $35,507 | $85,547 |
| 2017 | $1,226 | $118,681 | $34,811 | $83,870 |
| 2016 | $1,175 | $116,353 | $34,128 | $82,225 |
| 2015 | $1,113 | $114,605 | $33,615 | $80,990 |
| 2014 | $1,113 | $111,000 | $28,000 | $83,000 |
Source: Public Records
Map
Nearby Homes
- 1045 N Westside St
- 1076 N Beverly St
- 700 N Prospect St
- 1245 Atkins St
- 640 N Prospect St
- 1089 Pioneer Ave
- 1121 N Lindale Way
- 1370 Lindale Place
- 681 W Mulberry Ave
- 1041 Greenfield Dr
- 701 W Theta Ave
- 701 Theta Ave
- 680 W Gerry Cir
- 829 Pioneer Ave
- 1421 Pamela Cir
- 816 W Grand Ave
- 927 Shadowood Place
- 793 Pioneer Ave
- 1060 W Belleview Ave
- 824 W Grand Ave
- 1031 Douglas St
- 1021 Douglas St
- 1140 W Mulberry Ave
- 1120 W Mulberry Ave
- 1040 Douglas St
- 1011 Douglas St
- 1150 W Mulberry Ave
- 1030 Douglas St
- 1110 W Mulberry Ave
- 1020 Douglas St
- 1020 Douglas Ct
- 1001 Douglas St
- 1100 W Mulberry Ave
- 1170 W Mulberry Ave
- 1010 Douglas St
- 1121 Sandra Ave
- 1141 Sandra Ave
- 1131 Sandra Ave
- 1090 W Mulberry Ave
- 1134 Bel Aire Cir