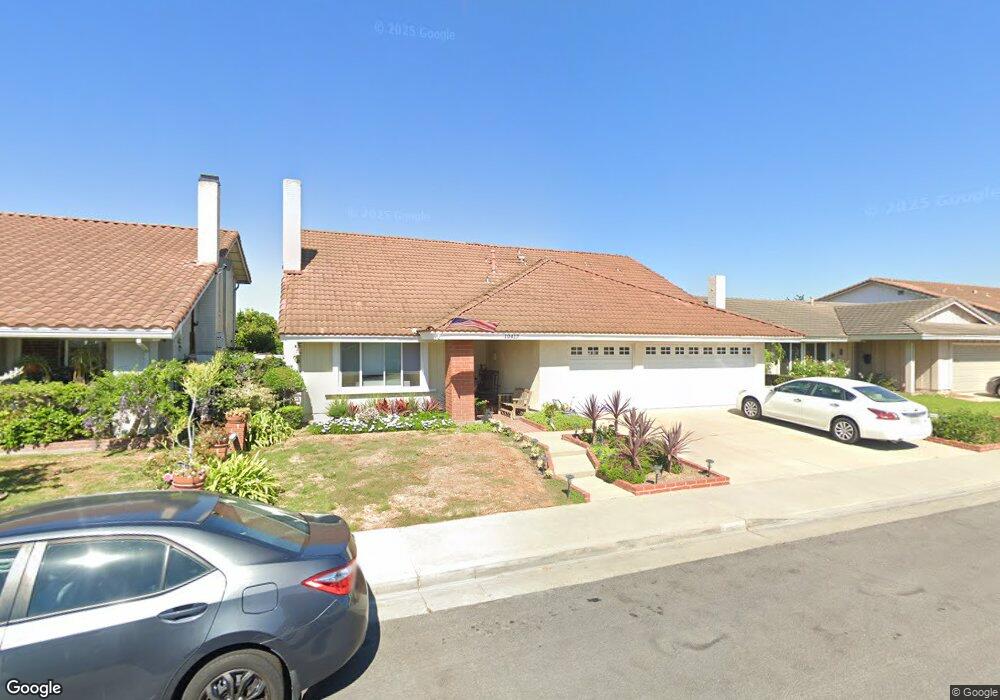
10417 La Cebra Ave Fountain Valley, CA 92708
Estimated Value: $1,445,775 - $1,560,000
4
Beds
3
Baths
2,200
Sq Ft
$677/Sq Ft
Est. Value
About This Home
This home is located at 10417 La Cebra Ave, Fountain Valley, CA 92708 and is currently estimated at $1,488,444, approximately $676 per square foot. 10417 La Cebra Ave is a home located in Orange County with nearby schools including Cox (James H.) Elementary School, Masuda (Kazuo) Middle School, and Fountain Valley High School.
Ownership History
Date
Name
Owned For
Owner Type
Purchase Details
Closed on
Nov 13, 2020
Sold by
Nguyen Tuan Bao and Nguyen Kimhuong Thi
Bought by
Nguyen Tuan Bao and Nguyen Kimhuong Thi
Current Estimated Value
Purchase Details
Closed on
Apr 10, 2020
Sold by
Brooks Victoria
Bought by
Nguyen Tuan Bao and Nguyen Kimhuong Thi
Home Financials for this Owner
Home Financials are based on the most recent Mortgage that was taken out on this home.
Original Mortgage
$638,400
Outstanding Balance
$563,386
Interest Rate
3.2%
Mortgage Type
New Conventional
Estimated Equity
$925,058
Purchase Details
Closed on
Feb 5, 2019
Sold by
Brooks Victoria
Bought by
Brooks Victoria
Purchase Details
Closed on
Mar 26, 2003
Sold by
Prebys Theodore C and Prebys Mary J
Bought by
Prebys Theodore C and Prebys Mary J
Create a Home Valuation Report for This Property
The Home Valuation Report is an in-depth analysis detailing your home's value as well as a comparison with similar homes in the area
Home Values in the Area
Average Home Value in this Area
Purchase History
| Date | Buyer | Sale Price | Title Company |
|---|---|---|---|
| Nguyen Tuan Bao | -- | Accommodation | |
| Nguyen Tuan Bao | $798,000 | Lawyers Title Company | |
| Brooks Victoria | -- | None Available | |
| Prebys Theodore C | -- | -- |
Source: Public Records
Mortgage History
| Date | Status | Borrower | Loan Amount |
|---|---|---|---|
| Open | Nguyen Tuan Bao | $638,400 |
Source: Public Records
Tax History Compared to Growth
Tax History
| Year | Tax Paid | Tax Assessment Tax Assessment Total Assessment is a certain percentage of the fair market value that is determined by local assessors to be the total taxable value of land and additions on the property. | Land | Improvement |
|---|---|---|---|---|
| 2025 | $11,254 | $1,028,025 | $882,402 | $145,623 |
| 2024 | $11,254 | $1,007,868 | $865,100 | $142,768 |
| 2023 | $10,993 | $988,106 | $848,137 | $139,969 |
| 2022 | $10,838 | $968,732 | $831,507 | $137,225 |
| 2021 | $10,628 | $949,738 | $815,203 | $134,535 |
| 2020 | $1,242 | $81,315 | $25,754 | $55,561 |
| 2019 | $1,223 | $79,721 | $25,249 | $54,472 |
| 2018 | $1,126 | $78,158 | $24,754 | $53,404 |
| 2017 | $1,107 | $76,626 | $24,269 | $52,357 |
| 2016 | $1,068 | $75,124 | $23,793 | $51,331 |
| 2015 | $1,050 | $73,996 | $23,436 | $50,560 |
| 2014 | $1,028 | $72,547 | $22,977 | $49,570 |
Source: Public Records
Map
Nearby Homes
- 10430 La Cebra Ave
- 18021 Roch Ct
- 18016 Roch Ct
- 10452 Circulo de Juarez
- 10900 La Flor Ave
- 10322 Avenida Cinco de Mayo
- 10231 Bunting Ave
- 17210 San Mateo St Unit 25
- 17333 Brookhurst St Unit D6
- 17333 Brookhurst St Unit B7
- 17288 San Lorenzo Cir
- 17401 Hood Ct
- 17077 Los Modelos St
- 259 Albatross Ln
- 914 Ironwood Ln
- 907 Ironwood Ln
- 809 Eucalyptus Ln
- 718 Catalpa Ln
- 300 Magpie Ln
- 715 Catalpa Ln
- 10405 La Cebra Ave
- 10429 La Cebra Ave
- 10416 El Monterey Ave
- 10395 La Cebra Ave
- 10439 La Cebra Ave
- 10428 El Monterey Ave
- 10406 El Monterey Ave
- 10420 La Cebra Ave
- 10408 La Cebra Ave
- 10440 El Monterey Ave
- 10394 El Monterey Ave
- 10383 La Cebra Ave
- 10451 La Cebra Ave
- 10396 La Cebra Ave
- 10442 La Cebra Ave
- 10450 El Monterey Ave
- 10382 El Monterey Ave
- 10384 La Cebra Ave
- 10373 La Cebra Ave
- 10454 La Cebra Ave