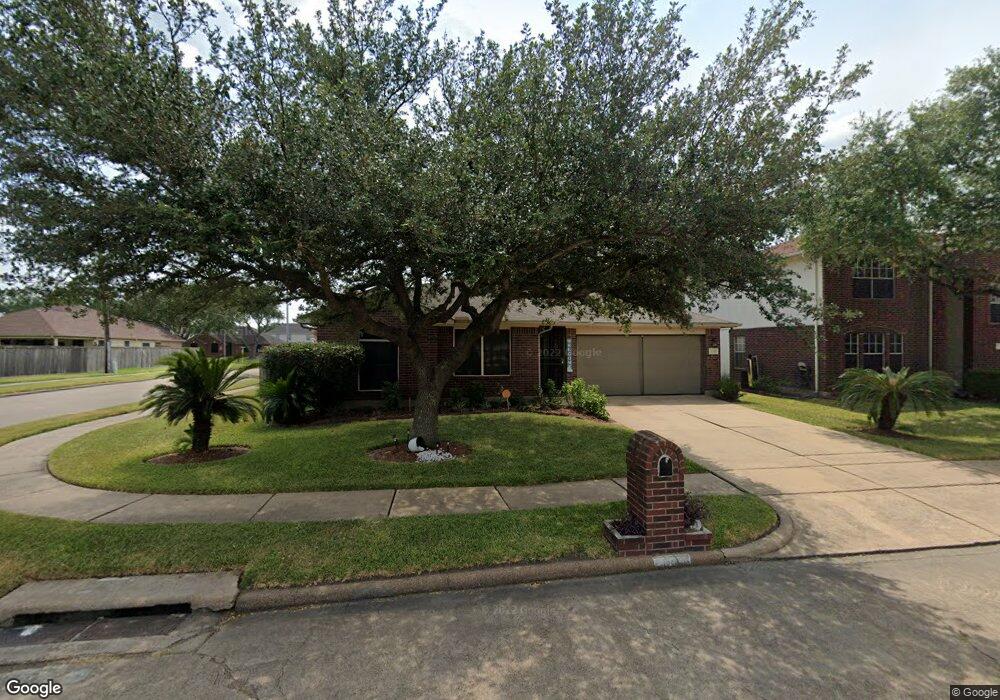
1042 Stevenage Ln Channelview, TX 77530
Estimated Value: $247,000 - $262,000
4
Beds
2
Baths
1,988
Sq Ft
$129/Sq Ft
Est. Value
About This Home
This home is located at 1042 Stevenage Ln, Channelview, TX 77530 and is currently estimated at $255,787, approximately $128 per square foot. 1042 Stevenage Ln is a home located in Harris County with nearby schools including Channelview High School, Family Christian Academy, and Creative Corner.
Ownership History
Date
Name
Owned For
Owner Type
Purchase Details
Closed on
Jun 8, 1999
Sold by
Hud
Bought by
Martin Bobbie F and Martin Ambrose C
Current Estimated Value
Home Financials for this Owner
Home Financials are based on the most recent Mortgage that was taken out on this home.
Original Mortgage
$90,000
Outstanding Balance
$23,482
Interest Rate
6.92%
Mortgage Type
FHA
Estimated Equity
$232,305
Purchase Details
Closed on
Feb 12, 1999
Sold by
Countrywide Home Loans Inc
Bought by
Hud
Purchase Details
Closed on
Nov 3, 1998
Sold by
Williams Tyrone A
Bought by
Countrywide Home Loans Inc
Purchase Details
Closed on
Nov 21, 1996
Sold by
Mhi Partnership Ltd
Bought by
Williams Tyrone A
Home Financials for this Owner
Home Financials are based on the most recent Mortgage that was taken out on this home.
Original Mortgage
$87,106
Interest Rate
7.9%
Mortgage Type
FHA
Create a Home Valuation Report for This Property
The Home Valuation Report is an in-depth analysis detailing your home's value as well as a comparison with similar homes in the area
Home Values in the Area
Average Home Value in this Area
Purchase History
| Date | Buyer | Sale Price | Title Company |
|---|---|---|---|
| Martin Bobbie F | $92,686 | -- | |
| Hud | -- | -- | |
| Countrywide Home Loans Inc | $96,104 | -- | |
| Williams Tyrone A | -- | Heritage Title Company |
Source: Public Records
Mortgage History
| Date | Status | Borrower | Loan Amount |
|---|---|---|---|
| Open | Martin Bobbie F | $90,000 | |
| Previous Owner | Williams Tyrone A | $87,106 |
Source: Public Records
Tax History Compared to Growth
Tax History
| Year | Tax Paid | Tax Assessment Tax Assessment Total Assessment is a certain percentage of the fair market value that is determined by local assessors to be the total taxable value of land and additions on the property. | Land | Improvement |
|---|---|---|---|---|
| 2025 | $752 | $263,239 | $33,185 | $230,054 |
| 2024 | $752 | $254,753 | $33,185 | $221,568 |
| 2023 | $752 | $274,401 | $33,185 | $241,216 |
| 2022 | $4,633 | $229,915 | $33,185 | $196,730 |
| 2021 | $4,461 | $181,653 | $33,185 | $148,468 |
| 2020 | $4,432 | $190,184 | $30,088 | $160,096 |
| 2019 | $4,188 | $187,242 | $30,088 | $157,154 |
| 2018 | $628 | $138,143 | $32,046 | $106,097 |
| 2017 | $3,537 | $138,143 | $32,046 | $106,097 |
| 2016 | $3,304 | $122,081 | $25,637 | $96,444 |
| 2015 | $2,577 | $106,659 | $16,344 | $90,315 |
| 2014 | $2,577 | $93,410 | $12,818 | $80,592 |
Source: Public Records
Map
Nearby Homes
- 1123 Maclesby Ln
- 1034 Littleport Ln
- 1130 Fairlane Square
- 1315 Goswell Ln
- 1330 Stevenage Ln
- 909 Pennygent Ln
- 1343 Littleport Ln
- 1102 Heathfield Dr
- 910 Calm Creek Ct
- 15122 Sheffield Terrace
- 830 Stonyridge St
- 15262 Mincing Ln
- 826 Ivy Hollow St
- 15225 Woodforest Blvd
- 15318 Streatham Cir
- 1323 Padstow Ln
- 15307 Streatham Cir
- 814 Deercrest St
- 15223 Bedford Glen Dr
- 1231 Nuevo Carrasco Ln
- 1038 Stevenage Ln
- 1055 Ambrosden Ln
- 1102 Stevenage Ln
- 1034 Stevenage Ln
- 1047 Ambrosden Ln
- 1103 Ambrosden Ln
- 1043 Stevenage Ln
- 1039 Stevenage Ln
- 1045 Ambrosden Ln
- 1106 Stevenage Ln
- 1035 Stevenage Ln
- 1107 Stevenage Ln
- 1107 Ambrosden Ln
- 1030 Stevenage Ln
- 1110 Stevenage Ln
- 1111 Stevenage Ln
- 1039 Ambrosden Ln
- 1111 Ambrosden Ln
- 1058 Leadenhall Cir
- 1046 Ambrosden Ln