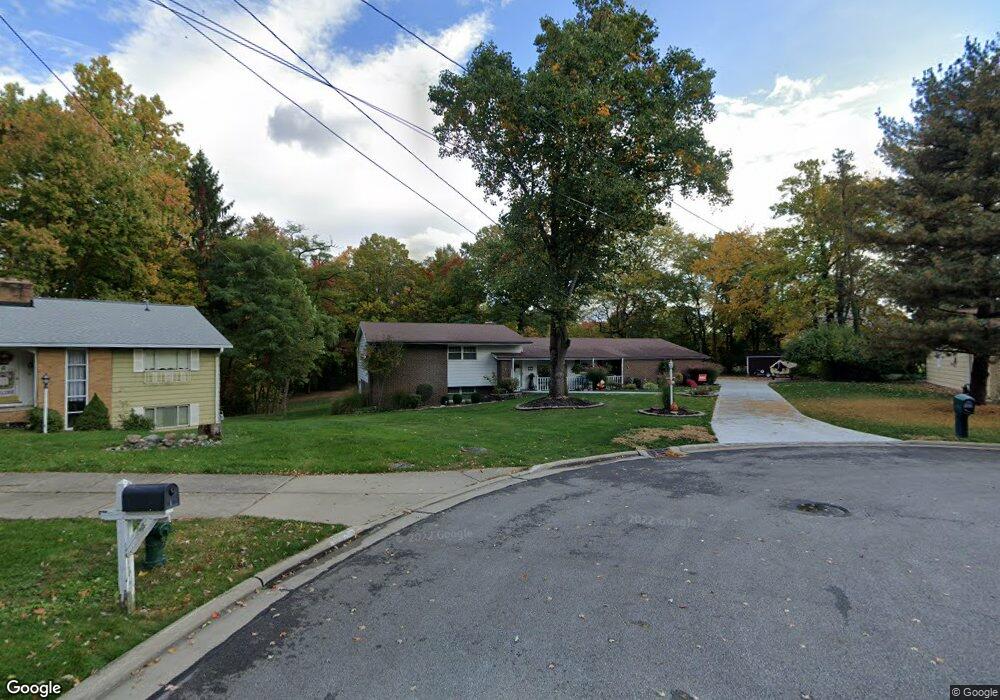
10437 King Coe Ln Strongsville, OH 44149
Estimated Value: $367,174 - $434,000
3
Beds
2
Baths
2,610
Sq Ft
$154/Sq Ft
Est. Value
About This Home
This home is located at 10437 King Coe Ln, Strongsville, OH 44149 and is currently estimated at $400,794, approximately $153 per square foot. 10437 King Coe Ln is a home located in Cuyahoga County with nearby schools including Strongsville High School, Sts Joseph & John Interparochial School, and The Academy of St. Bartholomew.
Ownership History
Date
Name
Owned For
Owner Type
Purchase Details
Closed on
Nov 18, 1999
Sold by
Bell Mary Lou and Bell Lowell W
Bought by
Pecoraro Carl J and Pecoraro Amy L
Current Estimated Value
Home Financials for this Owner
Home Financials are based on the most recent Mortgage that was taken out on this home.
Original Mortgage
$190,287
Outstanding Balance
$58,759
Interest Rate
7.9%
Mortgage Type
FHA
Estimated Equity
$342,035
Purchase Details
Closed on
Jul 24, 1992
Sold by
Vaihinger Armin F
Bought by
Bell Lowell W
Purchase Details
Closed on
Sep 22, 1982
Sold by
Harris Marlene J
Bought by
Vaihinger Armin F
Purchase Details
Closed on
Jun 10, 1977
Sold by
Harris Jack D and Harris Marlene J
Bought by
Harris Marlene J
Purchase Details
Closed on
Jan 1, 1975
Bought by
Harris Jack D and Harris Marlene J
Create a Home Valuation Report for This Property
The Home Valuation Report is an in-depth analysis detailing your home's value as well as a comparison with similar homes in the area
Home Values in the Area
Average Home Value in this Area
Purchase History
| Date | Buyer | Sale Price | Title Company |
|---|---|---|---|
| Pecoraro Carl J | $191,900 | Guardian Title | |
| Bell Lowell W | $139,800 | -- | |
| Vaihinger Armin F | $110,000 | -- | |
| Harris Marlene J | -- | -- | |
| Harris Jack D | -- | -- |
Source: Public Records
Mortgage History
| Date | Status | Borrower | Loan Amount |
|---|---|---|---|
| Open | Pecoraro Carl J | $190,287 |
Source: Public Records
Tax History Compared to Growth
Tax History
| Year | Tax Paid | Tax Assessment Tax Assessment Total Assessment is a certain percentage of the fair market value that is determined by local assessors to be the total taxable value of land and additions on the property. | Land | Improvement |
|---|---|---|---|---|
| 2024 | $5,075 | $108,080 | $25,655 | $82,425 |
| 2023 | $5,271 | $84,180 | $21,700 | $62,480 |
| 2022 | $5,233 | $84,175 | $21,700 | $62,475 |
| 2021 | $5,191 | $84,180 | $21,700 | $62,480 |
| 2020 | $5,148 | $73,850 | $19,040 | $54,810 |
| 2019 | $4,997 | $211,000 | $54,400 | $156,600 |
| 2018 | $4,513 | $73,850 | $19,040 | $54,810 |
| 2017 | $4,574 | $68,950 | $15,540 | $53,410 |
| 2016 | $4,537 | $68,950 | $15,540 | $53,410 |
| 2015 | $5,234 | $68,950 | $15,540 | $53,410 |
| 2014 | $5,234 | $78,440 | $15,090 | $63,350 |
Source: Public Records
Map
Nearby Homes
- 19240 Briarwood Ln
- 10986 Fawn Meadow Ln
- 19890 Idlewood Trail
- 11179 Fawn Meadow Ln
- 11432 Pearl Rd
- 11499 Pearl Rd Unit A106
- 19997 Idlewood Trail
- 20050 Idlewood Trail
- 20424 Scotch Pine Way
- 9401 Pheasant Run Place
- 18433 Whitney Rd
- 11650 River Moss Rd
- 20684 Albion Rd
- 18336 Falling Water Rd
- 12385 Corinth Ct
- 12539 Olympus Way
- 18737 Evergreen Dr
- 10839 Prospect Rd
- 12647 Edgepark Cir
- 17945 Cliffside Dr
- 10385 King Coe Ln
- 10485 King Coe Ln
- 19162 Albion Rd
- 10567 King Coe Ln
- 10432 King Coe Ln
- 10480 King Coe Ln
- 10526 King Coe Ln
- 10575 King Coe Ln
- 10570 King Coe Ln
- 19160 Albion Rd
- 10617 King Coe Ln
- 10345 Jerry Coe Ln
- 10612 King Coe Ln
- 10590 Pearl Rd
- 10567 Jerry Coe Ln
- 10660 King Coe Ln
- 10665 King Coe Ln
- 10346 Jerry Coe Ln
- 10613 Jerry Coe Ln
- 10484 Jerry Coe Ln