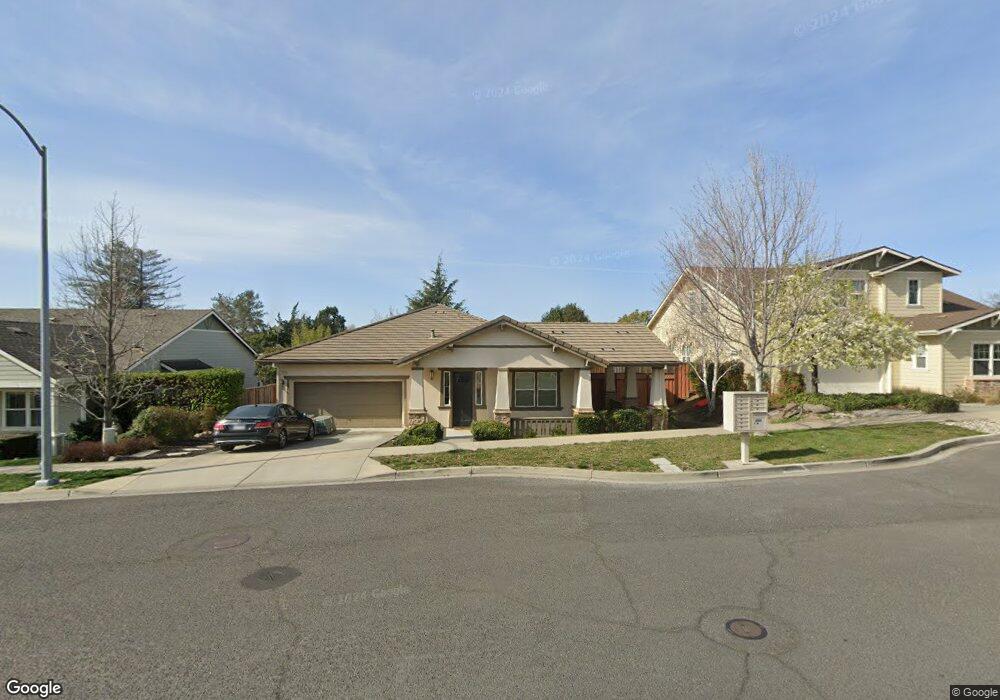
1045 Birkdale Dr Napa, CA 94559
Terrace NeighborhoodEstimated Value: $1,118,000 - $1,351,000
4
Beds
3
Baths
2,156
Sq Ft
$570/Sq Ft
Est. Value
About This Home
This home is located at 1045 Birkdale Dr, Napa, CA 94559 and is currently estimated at $1,227,897, approximately $569 per square foot. 1045 Birkdale Dr is a home located in Napa County with nearby schools including Phillips Elementary, Silverado Middle School, and Napa High School.
Ownership History
Date
Name
Owned For
Owner Type
Purchase Details
Closed on
Oct 29, 2020
Sold by
Oliver Thomas J and Oliver Julie I
Bought by
Oliver Thomas J and Oliver Julie I
Current Estimated Value
Purchase Details
Closed on
Oct 22, 2015
Sold by
Oliver Thomas J and Oliver Julie I
Bought by
Thomas J & Julie I Oliver Family Trust
Purchase Details
Closed on
Sep 15, 2011
Sold by
Cnb Rci Llc
Bought by
Oliver Thomas J and Oliver Julie I
Home Financials for this Owner
Home Financials are based on the most recent Mortgage that was taken out on this home.
Original Mortgage
$417,000
Interest Rate
4.37%
Mortgage Type
New Conventional
Purchase Details
Closed on
Dec 13, 2010
Sold by
Sonoma Napa Partners Llc
Bought by
Cnb Rci Llc
Home Financials for this Owner
Home Financials are based on the most recent Mortgage that was taken out on this home.
Original Mortgage
$1,223,000
Interest Rate
4.21%
Mortgage Type
Construction
Create a Home Valuation Report for This Property
The Home Valuation Report is an in-depth analysis detailing your home's value as well as a comparison with similar homes in the area
Home Values in the Area
Average Home Value in this Area
Purchase History
| Date | Buyer | Sale Price | Title Company |
|---|---|---|---|
| Oliver Thomas J | $417,000 | Amrock | |
| Oliver Thomas J | $417,000 | Amrock Llc | |
| Thomas J & Julie I Oliver Family Trust | -- | None Available | |
| Oliver Thomas J | -- | First American Title Company | |
| Cnb Rci Llc | -- | First American Title Company |
Source: Public Records
Mortgage History
| Date | Status | Borrower | Loan Amount |
|---|---|---|---|
| Previous Owner | Oliver Thomas J | $417,000 | |
| Previous Owner | Cnb Rci Llc | $1,223,000 |
Source: Public Records
Tax History Compared to Growth
Tax History
| Year | Tax Paid | Tax Assessment Tax Assessment Total Assessment is a certain percentage of the fair market value that is determined by local assessors to be the total taxable value of land and additions on the property. | Land | Improvement |
|---|---|---|---|---|
| 2025 | $9,084 | $769,369 | $219,803 | $549,566 |
| 2024 | $9,084 | $754,285 | $215,494 | $538,791 |
| 2023 | $9,084 | $693,496 | $211,269 | $482,227 |
| 2022 | $7,846 | $638,723 | $207,127 | $431,596 |
| 2021 | $7,736 | $626,200 | $203,066 | $423,134 |
| 2020 | $7,680 | $619,780 | $200,984 | $418,796 |
| 2019 | $7,521 | $607,629 | $197,044 | $410,585 |
| 2018 | $7,420 | $595,716 | $193,181 | $402,535 |
| 2017 | $7,272 | $584,037 | $189,394 | $394,643 |
| 2016 | $7,135 | $572,586 | $185,681 | $386,905 |
| 2015 | $6,680 | $563,986 | $182,892 | $381,094 |
| 2014 | $6,579 | $552,939 | $179,310 | $373,629 |
Source: Public Records
Map
Nearby Homes
- 1057 Birkdale Dr
- 1111 Terrace Dr
- 1203 Peppergrass St
- 1043 La Quinta Ct
- 1018 Oakmont Ct
- 1212 Peppergrass St
- 37 Sage Way
- 1060 Oakmont Ct
- 349 Vinterra Ct
- 1069 Coombsville Rd
- 859 Liberty Dr
- 28 Belvedere Ct
- 150 Silverado Trail Unit 70
- 150 Silverado Trail Unit 22
- 0 Fairview Dr
- 6 Pascale Ct
- 2040 Polley Dr
- 2004 S Terrace Dr
- 15 Julian Ave
- 2048 Sommer St
- 1051 Birkdale Dr
- 1039 Birkdale Dr
- 1023 Terra Verde Dr
- 1017 Terra Verde Dr
- 1042 Birkdale Dr
- 1020 Wyatt Ave
- 1105 Pennyroyal St
- 1018 Wyatt Ave
- 1011 Terra Verde Dr
- 1108 Pennyroyal St
- 1111 Pennyroyal St
- 1063 Birkdale Dr
- 1033 Birkdale Dr
- 1147 Pennyroyal St
- 1024 Wyatt Ave
- 1104 Wyatt Ave
- 1007 Terra Verde Dr
- 1114 Pennyroyal St
- 1022 Terra Verde Dr
- 1036 Birkdale Dr