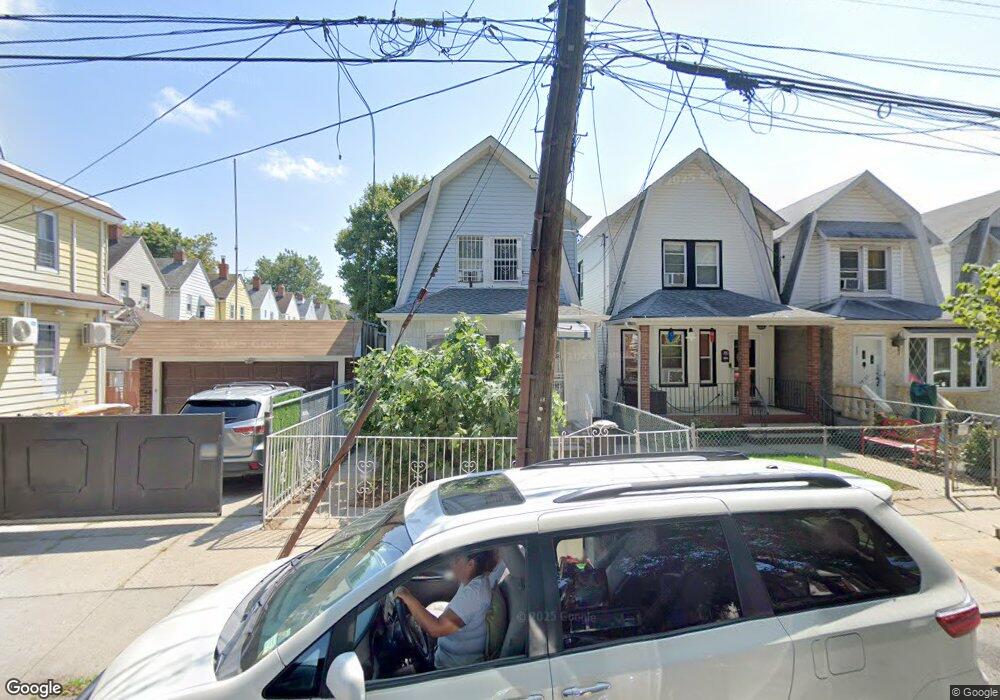
10456 92nd Ave Richmond Hill, NY 11418
Richmond Hill NeighborhoodEstimated Value: $722,953 - $969,000
--
Bed
--
Bath
1,280
Sq Ft
$630/Sq Ft
Est. Value
About This Home
This home is located at 10456 92nd Ave, Richmond Hill, NY 11418 and is currently estimated at $805,988, approximately $629 per square foot. 10456 92nd Ave is a home located in Queens County with nearby schools including P.S. 90 - Horace Mann, M.S.137 America's School of Heroes, and Richmond Hill High School.
Ownership History
Date
Name
Owned For
Owner Type
Purchase Details
Closed on
Mar 23, 2004
Sold by
Cartagena Henry
Bought by
Osores and Nibardo
Current Estimated Value
Purchase Details
Closed on
Aug 27, 1996
Sold by
Point Shirley
Bought by
Osores Nibardo and Ramon Marco
Home Financials for this Owner
Home Financials are based on the most recent Mortgage that was taken out on this home.
Original Mortgage
$166,400
Interest Rate
8.06%
Mortgage Type
FHA
Create a Home Valuation Report for This Property
The Home Valuation Report is an in-depth analysis detailing your home's value as well as a comparison with similar homes in the area
Home Values in the Area
Average Home Value in this Area
Purchase History
| Date | Buyer | Sale Price | Title Company |
|---|---|---|---|
| Osores | -- | -- | |
| Osores | -- | -- | |
| Osores | -- | -- | |
| Osores Nibardo | $166,500 | Commonwealth Land Title Ins | |
| Osores Nibardo | $166,500 | Commonwealth Land Title Ins |
Source: Public Records
Mortgage History
| Date | Status | Borrower | Loan Amount |
|---|---|---|---|
| Previous Owner | Osores Nibardo | $166,400 | |
| Closed | Osores | $0 |
Source: Public Records
Tax History Compared to Growth
Tax History
| Year | Tax Paid | Tax Assessment Tax Assessment Total Assessment is a certain percentage of the fair market value that is determined by local assessors to be the total taxable value of land and additions on the property. | Land | Improvement |
|---|---|---|---|---|
| 2025 | $2,741 | $31,888 | $8,004 | $23,884 |
| 2024 | $2,753 | $30,097 | $8,919 | $21,178 |
| 2023 | $2,704 | $29,722 | $7,940 | $21,782 |
| 2022 | $2,673 | $39,300 | $11,220 | $28,080 |
| 2021 | $2,667 | $32,580 | $11,220 | $21,360 |
| 2020 | $2,516 | $31,440 | $11,220 | $20,220 |
| 2019 | $2,330 | $34,500 | $11,220 | $23,280 |
| 2018 | $2,227 | $24,768 | $8,641 | $16,127 |
| 2017 | $4,738 | $24,715 | $9,170 | $15,545 |
| 2016 | $4,381 | $24,715 | $9,170 | $15,545 |
| 2015 | $2,592 | $22,144 | $11,720 | $10,424 |
| 2014 | $2,592 | $20,901 | $10,734 | $10,167 |
Source: Public Records
Map
Nearby Homes