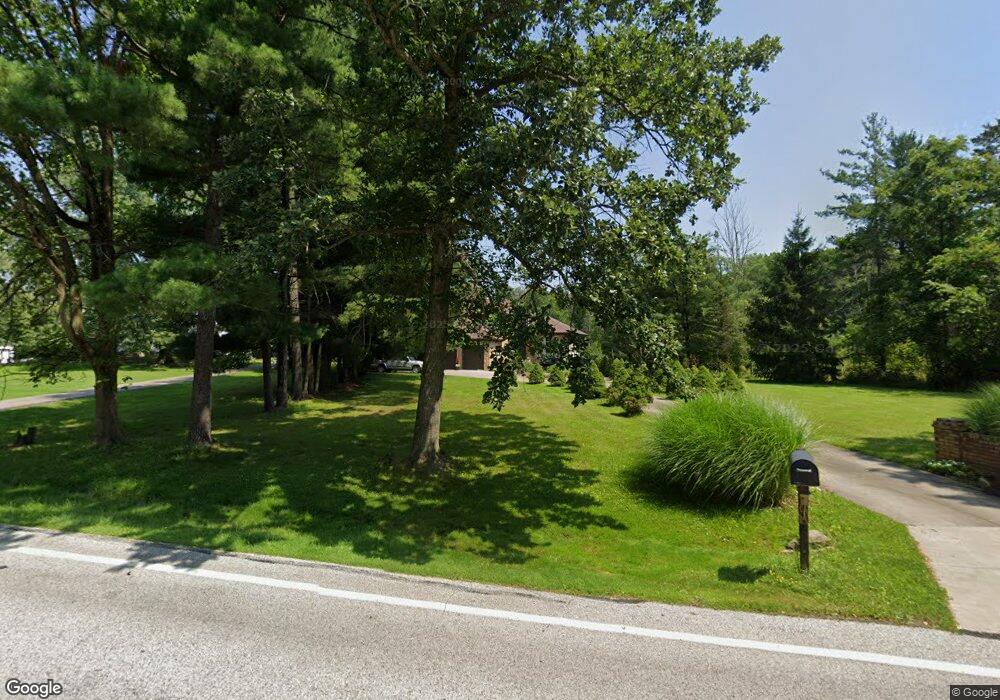
10462 Edgerton Rd North Royalton, OH 44133
Estimated Value: $450,988 - $580,000
4
Beds
5
Baths
2,738
Sq Ft
$186/Sq Ft
Est. Value
About This Home
This home is located at 10462 Edgerton Rd, North Royalton, OH 44133 and is currently estimated at $508,497, approximately $185 per square foot. 10462 Edgerton Rd is a home located in Cuyahoga County with nearby schools including North Royalton Middle School, North Royalton High School, and Royal Redeemer Lutheran School.
Ownership History
Date
Name
Owned For
Owner Type
Purchase Details
Closed on
Oct 27, 2008
Sold by
Zabrecky Lidiya
Bought by
Lipp Daniela and Lipp Steven
Current Estimated Value
Purchase Details
Closed on
Aug 23, 2006
Sold by
Sroka Mikolaj and Sroka Jadwiga
Bought by
Zabrecky Lidiya
Home Financials for this Owner
Home Financials are based on the most recent Mortgage that was taken out on this home.
Original Mortgage
$280,250
Outstanding Balance
$168,441
Interest Rate
6.78%
Mortgage Type
Purchase Money Mortgage
Estimated Equity
$340,057
Purchase Details
Closed on
Oct 1, 1992
Sold by
Timar Elizabeth H
Bought by
Sroka Mikolaj
Purchase Details
Closed on
Feb 14, 1992
Sold by
Timar William and Timar Elizabeth
Bought by
Timar Elizabeth H
Purchase Details
Closed on
Jan 1, 1990
Bought by
Timar William and Timar Elizabeth
Create a Home Valuation Report for This Property
The Home Valuation Report is an in-depth analysis detailing your home's value as well as a comparison with similar homes in the area
Home Values in the Area
Average Home Value in this Area
Purchase History
| Date | Buyer | Sale Price | Title Company |
|---|---|---|---|
| Lipp Daniela | $265,100 | Homestar Title Agency Inc | |
| Zabrecky Lidiya | $295,000 | Chicago Title Insurance C | |
| Sroka Mikolaj | $32,500 | -- | |
| Timar Elizabeth H | -- | -- | |
| Timar William | -- | -- |
Source: Public Records
Mortgage History
| Date | Status | Borrower | Loan Amount |
|---|---|---|---|
| Open | Zabrecky Lidiya | $280,250 |
Source: Public Records
Tax History Compared to Growth
Tax History
| Year | Tax Paid | Tax Assessment Tax Assessment Total Assessment is a certain percentage of the fair market value that is determined by local assessors to be the total taxable value of land and additions on the property. | Land | Improvement |
|---|---|---|---|---|
| 2024 | $8,537 | $131,250 | $15,365 | $115,885 |
| 2023 | $8,766 | $123,980 | $16,070 | $107,910 |
| 2022 | $8,713 | $123,970 | $16,070 | $107,910 |
| 2021 | $8,795 | $123,970 | $16,070 | $107,910 |
| 2020 | $7,883 | $104,200 | $13,510 | $90,690 |
| 2019 | $7,679 | $297,700 | $38,600 | $259,100 |
| 2018 | $7,285 | $104,200 | $13,510 | $90,690 |
| 2017 | $7,217 | $91,740 | $12,110 | $79,630 |
| 2016 | $6,820 | $91,740 | $12,110 | $79,630 |
| 2015 | $5,781 | $91,740 | $12,110 | $79,630 |
| 2014 | $5,781 | $89,080 | $11,760 | $77,320 |
Source: Public Records
Map
Nearby Homes
- 9447 Lindberg Dr
- 11438 Drake Rd
- 10281 River Run Ln
- 11861 W Edgerton Rd
- 14835 Thornton Dr
- 8381 N Akins Rd Unit H7
- 10244 Hidden Valley Dr
- 11886 Friar Post
- 13831 Woodcroft Trace
- 18680 Bennett Rd
- 20842 Fawnhaven Dr
- 7400 Akins Rd
- 13690 W 130th St
- 12906 Cartwright Pkwy
- 13000 Cartwright Pkwy
- 13335 Tradewinds Dr
- S/L Margaret Dr
- 7595 Margaret Dr
- 7545 Margaret Dr
- 7585 Margaret Dr
- 10470 Edgerton Rd
- 10428 Edgerton Rd
- 10482 Edgerton Rd
- 10390 Edgerton Rd
- 10511 Edgerton Rd
- 10461 Edgerton Rd
- 10494 Edgerton Rd
- 10527 Edgerton Rd
- 10316 Edgerton Rd
- 10315 Edgerton Rd
- 10550 Edgerton Rd
- 10600 Edgerton Rd
- 10541 Edgerton Rd
- 15542 Raya Oval
- 15545 Raya Oval
- 10831 Silver Tree Trail
- 10238 Edgerton Rd
- 10841 Silver Tree Trail
- 10821 Silver Tree Trail
- 10279 Edgerton Rd