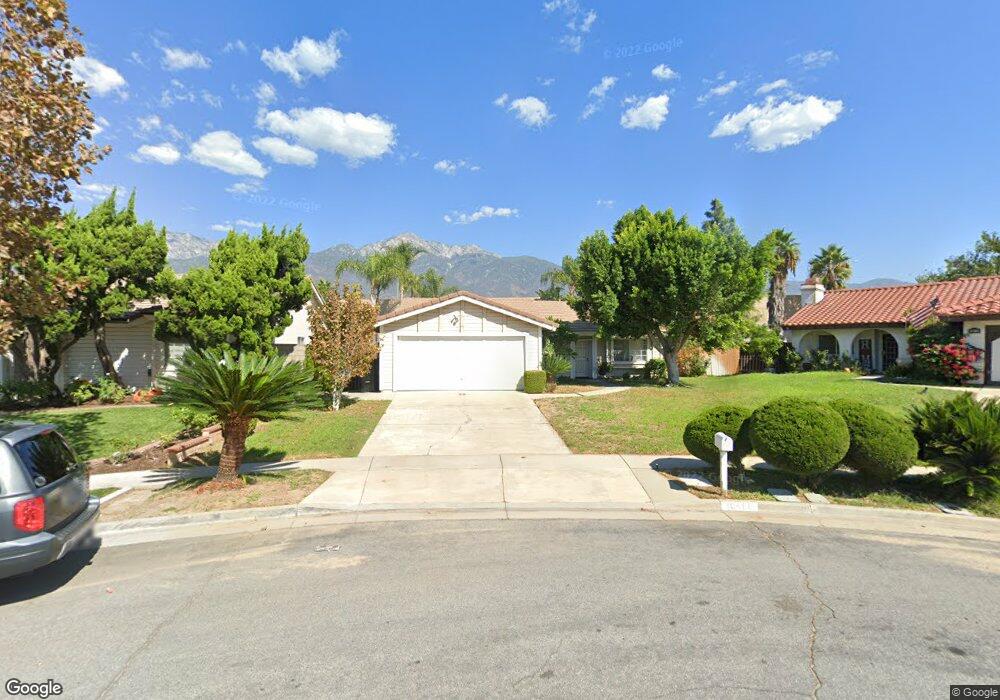
10466 Finch Ave Rancho Cucamonga, CA 91737
Estimated Value: $808,699 - $916,000
4
Beds
2
Baths
1,696
Sq Ft
$500/Sq Ft
Est. Value
About This Home
This home is located at 10466 Finch Ave, Rancho Cucamonga, CA 91737 and is currently estimated at $847,175, approximately $499 per square foot. 10466 Finch Ave is a home located in San Bernardino County with nearby schools including Deer Canyon Elementary, Vineyard Junior High, and Los Osos High.
Ownership History
Date
Name
Owned For
Owner Type
Purchase Details
Closed on
Jun 22, 1999
Sold by
Federal Home Loan Mortgage Corporation
Bought by
Candido Thomas and Candido Lydia
Current Estimated Value
Home Financials for this Owner
Home Financials are based on the most recent Mortgage that was taken out on this home.
Original Mortgage
$159,050
Outstanding Balance
$42,466
Interest Rate
7.2%
Estimated Equity
$804,709
Purchase Details
Closed on
Feb 5, 1999
Sold by
Dobb Barry and Dobb Jackie
Bought by
Federal Home Loan Mortgage Corporation
Create a Home Valuation Report for This Property
The Home Valuation Report is an in-depth analysis detailing your home's value as well as a comparison with similar homes in the area
Home Values in the Area
Average Home Value in this Area
Purchase History
| Date | Buyer | Sale Price | Title Company |
|---|---|---|---|
| Candido Thomas | $164,000 | First American Title | |
| Federal Home Loan Mortgage Corporation | $151,000 | American Title |
Source: Public Records
Mortgage History
| Date | Status | Borrower | Loan Amount |
|---|---|---|---|
| Open | Candido Thomas | $159,050 |
Source: Public Records
Tax History Compared to Growth
Tax History
| Year | Tax Paid | Tax Assessment Tax Assessment Total Assessment is a certain percentage of the fair market value that is determined by local assessors to be the total taxable value of land and additions on the property. | Land | Improvement |
|---|---|---|---|---|
| 2025 | $2,831 | $252,056 | $61,483 | $190,573 |
| 2024 | $2,831 | $247,113 | $60,277 | $186,836 |
| 2023 | $2,770 | $242,268 | $59,095 | $183,173 |
| 2022 | $2,762 | $237,517 | $57,936 | $179,581 |
| 2021 | $2,759 | $232,860 | $56,800 | $176,060 |
| 2020 | $2,652 | $230,473 | $56,218 | $174,255 |
| 2019 | $2,679 | $225,954 | $55,116 | $170,838 |
| 2018 | $2,621 | $221,523 | $54,035 | $167,488 |
| 2017 | $2,508 | $217,179 | $52,975 | $164,204 |
| 2016 | $2,443 | $212,920 | $51,936 | $160,984 |
| 2015 | $2,428 | $209,722 | $51,156 | $158,566 |
| 2014 | $2,362 | $205,614 | $50,154 | $155,460 |
Source: Public Records
Map
Nearby Homes
- 10456 Hamilton St
- 10414 Hamilton St
- 10655 Lemon Ave Unit 2703
- 10655 Lemon Ave Unit 2605
- 10655 Lemon Ave Unit 4004
- 10655 Lemon Ave Unit 1508
- 10655 Lemon Ave Unit 3004
- 10655 Lemon Ave Unit 4009
- 10655 Lemon Ave Unit 3613
- 10655 Lemon Ave Unit 3912
- 6644 Brissac Place
- 10123 Finch Ave
- 6600 Montresor Place
- 6516 Alameda Ave
- 6281 Kinlock Ave
- 6842 Palm Dr
- 10141 Orange St
- 10393 Cartilla Ct
- 6210 Halstead Ave
- 6162 Mayberry Ave
- 10458 Finch Ave
- 10472 Finch Ave
- 10448 Finch Ave
- 6561 Mesada St
- 10440 Finch Ave
- 6573 Mesada St
- 6580 Mesada St
- 10430 Finch Ave
- 6583 Mesada St
- 6581 Marine Ave
- 6590 Mesada St
- 10422 Finch Ave
- 6593 Mesada St
- 6591 Marine Ave
- 6600 Mesada St
- 6601 Marine Ave
- 6582 Marine Ave
- 6605 Mesada St
- 6545 Bandola St
- 6557 Bandola St