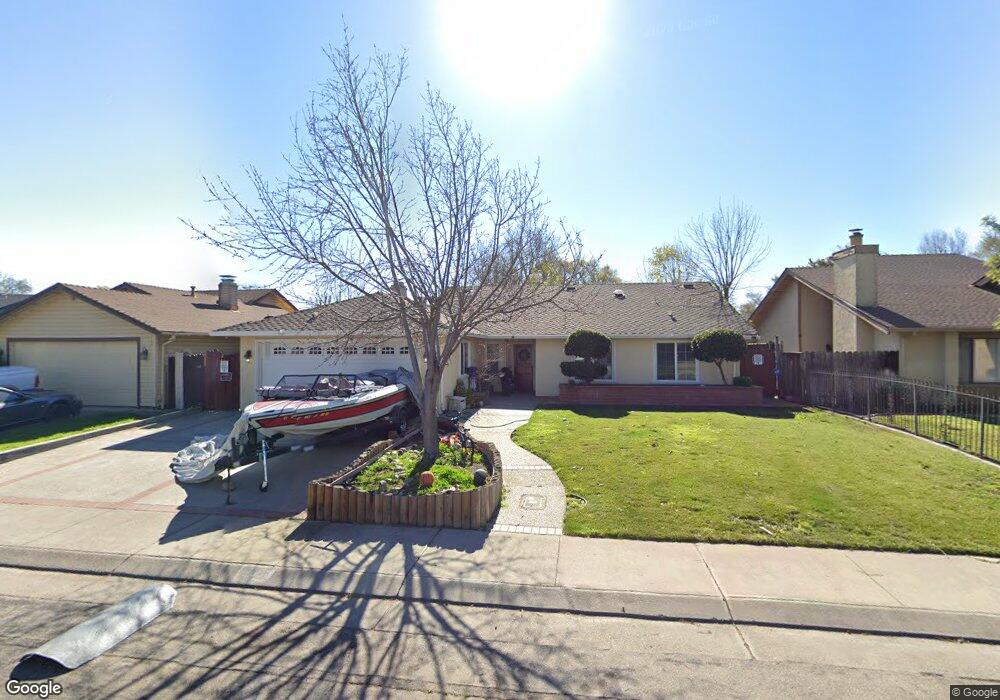
1048 Friar St Stockton, CA 95209
Stonewood NeighborhoodEstimated Value: $401,000 - $480,000
4
Beds
2
Baths
1,870
Sq Ft
$239/Sq Ft
Est. Value
About This Home
This home is located at 1048 Friar St, Stockton, CA 95209 and is currently estimated at $447,227, approximately $239 per square foot. 1048 Friar St is a home located in San Joaquin County with nearby schools including Oakwood Elementary School, Delta Sierra Middle School, and Bear Creek High School.
Ownership History
Date
Name
Owned For
Owner Type
Purchase Details
Closed on
May 9, 2025
Sold by
Molina Susana Yamileth Soto
Bought by
Soto Daniel A
Current Estimated Value
Purchase Details
Closed on
Jan 16, 2010
Sold by
Soto Daniel A
Bought by
Molina Susana Yamileth
Purchase Details
Closed on
Jun 16, 2009
Sold by
Owen Victor H and Owen Candace K
Bought by
Soto Daniel A
Purchase Details
Closed on
Mar 14, 2008
Sold by
Leon Marielena
Bought by
Owen Victor H and Owen Candace K
Purchase Details
Closed on
May 10, 2001
Sold by
Leon Norman
Bought by
Leon Marielena
Home Financials for this Owner
Home Financials are based on the most recent Mortgage that was taken out on this home.
Original Mortgage
$152,000
Interest Rate
6.89%
Mortgage Type
Stand Alone First
Create a Home Valuation Report for This Property
The Home Valuation Report is an in-depth analysis detailing your home's value as well as a comparison with similar homes in the area
Home Values in the Area
Average Home Value in this Area
Purchase History
| Date | Buyer | Sale Price | Title Company |
|---|---|---|---|
| Soto Daniel A | -- | None Listed On Document | |
| Molina Susana Yamileth | $90,000 | None Available | |
| Soto Daniel A | $90,000 | None Available | |
| Owen Victor H | $164,500 | Old Republic Title Company | |
| Leon Marielena | -- | Old Republic Title Company | |
| Leon Marielena | $190,000 | Old Republic Title Company |
Source: Public Records
Mortgage History
| Date | Status | Borrower | Loan Amount |
|---|---|---|---|
| Previous Owner | Leon Marielena | $152,000 |
Source: Public Records
Tax History Compared to Growth
Tax History
| Year | Tax Paid | Tax Assessment Tax Assessment Total Assessment is a certain percentage of the fair market value that is determined by local assessors to be the total taxable value of land and additions on the property. | Land | Improvement |
|---|---|---|---|---|
| 2025 | $2,185 | $200,064 | $51,627 | $148,437 |
| 2024 | $2,144 | $196,142 | $50,615 | $145,527 |
| 2023 | $2,118 | $192,297 | $49,623 | $142,674 |
| 2022 | $2,066 | $188,527 | $48,650 | $139,877 |
| 2021 | $2,112 | $184,832 | $47,697 | $137,135 |
| 2020 | $2,061 | $182,937 | $47,208 | $135,729 |
| 2019 | $2,012 | $179,351 | $46,283 | $133,068 |
| 2018 | $1,975 | $175,835 | $45,376 | $130,459 |
| 2017 | $1,927 | $172,388 | $44,487 | $127,901 |
| 2016 | $1,814 | $169,009 | $43,615 | $125,394 |
| 2014 | $1,789 | $163,212 | $42,119 | $121,093 |
Source: Public Records
Map
Nearby Homes
- 1017 Royal Oaks Dr
- 1020 Oakleaf Way
- 9511 Theresa Cir
- 916 Springoak Way
- 1418 Woodcreek Way
- 1626 Navajo Dr
- 9221 N El Dorado St
- 9418 Shawnee Ct
- 9431 Shawnee Ct
- 8715 Eastwood Ct
- 8811 Davis Rd
- 1235 Briarwood Way
- 1903 Chaparral Way
- 8603 Acapulco Way
- 8518 Burns Place
- 8824 N El Dorado St
- 948 Macduff Ave
- 214 Don Carlos Ave
- 8419 Macduff Ct
- 764 Macduff Ave
- 1056 Friar St
- 1040 Friar St
- 1033 Royal Oaks Dr
- 1103 Royal Oaks Dr
- 1104 Friar St
- 1025 Royal Oaks Dr
- 1111 Royal Oaks Dr
- 9530 Duchess Ln
- 1039 Friar St
- 1112 Friar St
- 1024 Friar St
- 1119 Royal Oaks Dr
- 1031 Friar St
- 9536 Duchess Ln
- 9529 Duchess Ln
- 1016 Friar St
- 1102 Royal Oaks Dr
- 1032 Royal Oaks Dr
- 1023 Friar St
- 1009 Royal Oaks Dr