105 Anita St Longview, TX 75603
Estimated Value: $182,000 - $260,000
--
Bed
2
Baths
1,560
Sq Ft
$136/Sq Ft
Est. Value
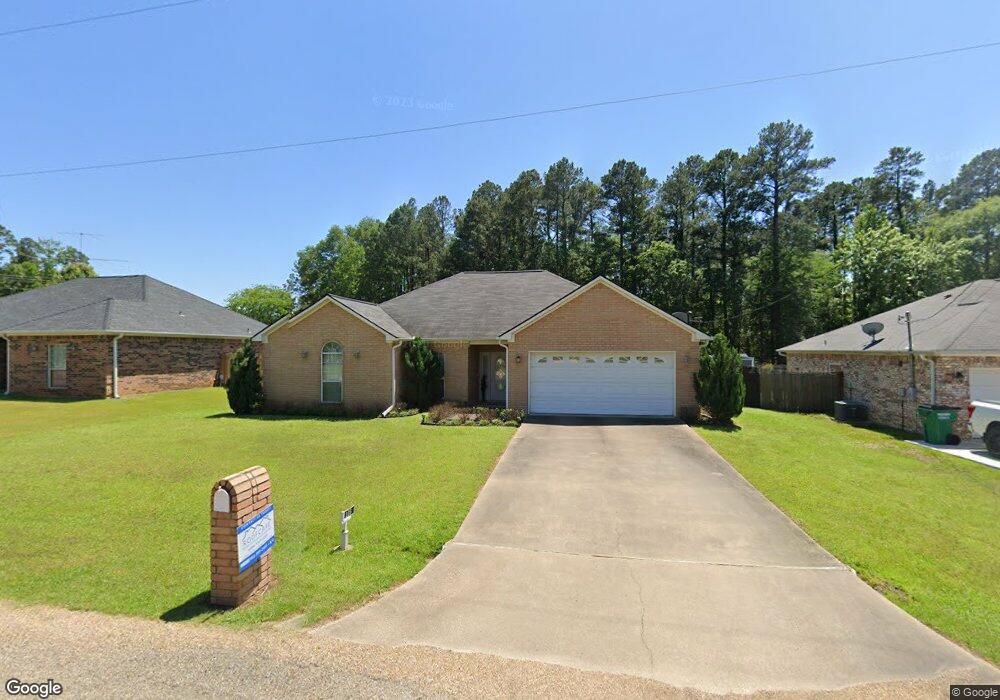
About This Home
This home is located at 105 Anita St, Longview, TX 75603 and is currently estimated at $212,651, approximately $136 per square foot. 105 Anita St is a home located in Gregg County with nearby schools including Ned E. Williams Elementary School.
Ownership History
Date
Name
Owned For
Owner Type
Purchase Details
Closed on
May 14, 2015
Sold by
Muckelroy Lewis Sandra Gail
Bought by
Muckelroy Derek Lamar
Current Estimated Value
Purchase Details
Closed on
May 2, 2006
Sold by
Mcmichael Mark
Bought by
Muckelroy Derek
Home Financials for this Owner
Home Financials are based on the most recent Mortgage that was taken out on this home.
Original Mortgage
$119,795
Interest Rate
6.32%
Mortgage Type
Unknown
Create a Home Valuation Report for This Property
The Home Valuation Report is an in-depth analysis detailing your home's value as well as a comparison with similar homes in the area
Home Values in the Area
Average Home Value in this Area
Purchase History
| Date | Buyer | Sale Price | Title Company |
|---|---|---|---|
| Muckelroy Derek Lamar | -- | Ctc | |
| Muckelroy Derek | $123,500 | Ctc |
Source: Public Records
Mortgage History
| Date | Status | Borrower | Loan Amount |
|---|---|---|---|
| Previous Owner | Muckelroy Derek | $119,795 |
Source: Public Records
Tax History Compared to Growth
Tax History
| Year | Tax Paid | Tax Assessment Tax Assessment Total Assessment is a certain percentage of the fair market value that is determined by local assessors to be the total taxable value of land and additions on the property. | Land | Improvement |
|---|---|---|---|---|
| 2025 | $2,735 | $207,390 | $7,500 | $199,890 |
| 2024 | $3,993 | $197,820 | $7,500 | $190,320 |
| 2023 | $3,557 | $189,980 | $7,500 | $182,480 |
| 2022 | $3,628 | $159,580 | $7,500 | $152,080 |
| 2021 | $3,605 | $151,550 | $7,500 | $144,050 |
| 2020 | $3,577 | $150,040 | $7,500 | $142,540 |
| 2019 | $3,645 | $148,570 | $7,500 | $141,070 |
| 2018 | $3,127 | $147,440 | $7,500 | $139,940 |
| 2017 | $3,629 | $147,790 | $7,500 | $140,290 |
| 2016 | $3,634 | $147,970 | $7,500 | $140,470 |
| 2015 | $3,194 | $148,660 | $7,500 | $141,160 |
| 2014 | -- | $149,710 | $7,500 | $142,210 |
Source: Public Records
Map
Nearby Homes